Process Flowchart
The main reason of using Process Flowchart or PFD is to show relations between major parts of the system. Process Flowcharts are used in process engineering and chemical industry where there is a requirement of depicting relationships between major components only and not include minor parts. Process Flowcharts for single unit or multiple units differ in their structure and implementation. ConceptDraw PRO is Professional business process mapping software for making Process flowcharts, Process flow diagram, Workflow diagram, flowcharts and technical illustrations for business documents and also comprehensive visio for mac application. Easier define and document basic work and data flows, financial, production and quality management processes to increase efficiency of your business with ConcepDraw PRO. Business process mapping software with Flowchart Maker ConceptDraw PRO includes extensive drawing tools, rich examples and templates, process flowchart symbols and shape libraries, smart connectors that allow you create the flowcharts of complex processes, process flow diagrams, procedures and information exchange. Process Flowchart Solution is project management workflow tools which is part ConceptDraw Project marketing project management software. Drawing charts, diagrams, and network layouts has long been the monopoly of Microsoft Visio, making Mac users to struggle when needing such visio alternative like visio for mac, it requires only to view features, make a minor edit to, or print a diagram or chart. Thankfully to MS Visio alternative like ConceptDraw PRO software, this is cross-platform charting and business process management tool, now visio alternative for making sort of visio diagram is not a problem anymore however many people still name it business process visio tools.
Mechanical Drawing Symbols
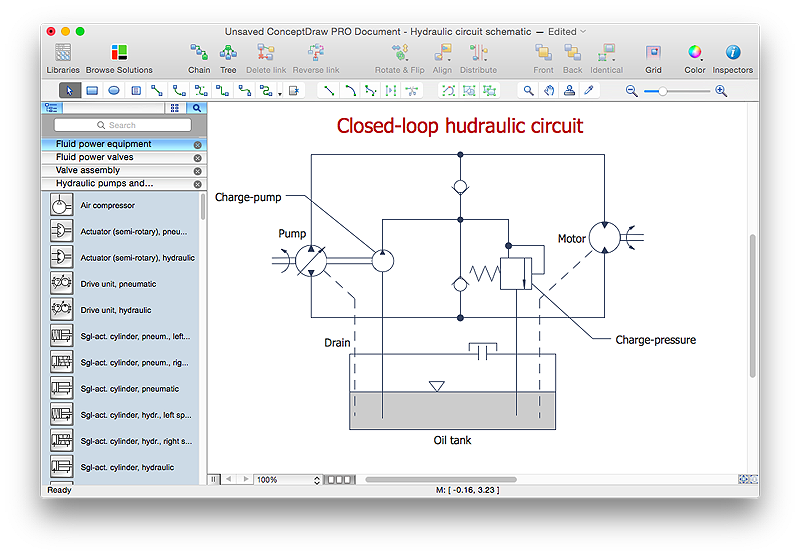
Mechanical Drawings are the special type of technical diagrams that visualize the structure of complex systems and illustrate the information about ventilation, heating, air conditioning, i.e. HVAC systems. These drawings are created on the base of floor plans and reflected ceiling plans, and then become an obligatory part of construction project which is needed directly for construction a building and for receiving a permit on it. Mechanical drawings and diagrams help effectively represent construction, technical and engineering solutions, and also schematics of different mechanical equipment. ConceptDraw PRO vector drawing software enhanced with Mechanical Engineering solution from Engineering area of ConceptDraw Solution Park provides wide set of effective drawing tools, predesigned mechanical drawing symbols, templates, samples and examples. Use of standardized and recognized mechanical vector symbols helps you design understandable mechanical drawings, diagrams and mechanical engineering schematics.UML Deployment Diagram. Design Elements
UML Deployment diagram describes the hardware used in system implementations and the execution environments and artifacts deployed on the hardware. ConceptDraw has 393 vector stencils in the 13 libraries that helps you to start using software for designing your own UML Diagrams. You can use the appropriate stencils of UML notation from UML Deployment library.Cross-Functional Flowchart
Use of Cross-Functional Flowchart is a clear way of showing each team member’s responsibilities and how processes get shared or transferred between different responsible people, teams and departments. Use the best flowchart maker ConceptDraw PRO with a range of standardized cross-functional flowchart symbols to create the Cross-Functional Flowcharts simply and to visualize the relationship between a business process and the functional units responsible for that process. To draw the most quickly Cross-Functional Flowcharts, Cross Functional Process Maps, or Cross Functional Process Flow Diagrams, start with a Cross-functional flowchart samples and templates from ConceptDraw Solution Park. The ConceptDraw Arrows10 and RapidDraw technologies will be also useful for you in drawing. ConceptDraw PRO supports designing both types - horizontal and vertical Cross-functional flowcharts. A vertical layout makes the accents mainly on the functional units while a horizontal layout - on the process. If you need a Visio alternative in Mac OS X, try ConceptDraw PRO. Its interface is very intuitive and it’s actually much easier to use than Visio, yet somehow it’s just as powerful if not more so. ConceptDraw PRO performs professional quality work and seamless Visio interaction.
Flowchart Software
Flowchart is a simple diagram, map or graphical schematic representation the sequence of actions within a process. It is ideal for displaying how a process currently flows or can function ideally. The Flowcharts let define the steps and boundaries of a process, uncover problems or miscommunications. The Flowcharts are widely used in education, software development, business, economics, thanks to their visuality they are ideal for presentations, reports, for using on conferences to help the audience comprehend the content better, or easy find flaws in a process flow diagrams. ConceptDraw PRO is professional flowcharts software and feature-rich flowchart maker, which supports Mac OS X and Windows. It contains at ConceptDraw Solution Park a rich set of stencils and professional flowchart symbols for design. It lets create simply professional-looking Flowcharts based on thousand free flowchart templates, colored symbols and examples. ConceptDraw PRO is a 3 times cheaper alternative to MS Visio available for both Mac and PC. It’s is another full featured business and technical diagramming application that can easily take care of Visio files within OS X. Another bonus with ConceptDraw PRO – it's cross-platform. You can work on a document in both OS X and Windows, skipping Visio entirely.
HelpDesk
How to Create a Mechanical Diagram
Mechanical Engineering drawing is a type of technical drawing that helps analyze complex engineering systems. Mechanical Engineering diagrams are often a set of detailed drawings used for engineering or construction projects. Making Mechanical Engineering diagram involves many different elements that can be managed using ConceptDraw PRO. You can design elements for drawing parts, assembly, pneumatic, and hydraulic systems for mechanical engineering. With ConceptDraw PRO you can easily create and communicate the Mechanical Engineering diagram of any complexity.Technical Drawing Software
In conditions of rapidly developing and progressing modern technologies in various fields of science and technics, a powerful specialized software is very popular and highly demanded today. In this area particularly valuable is a technical drawing software. ConceptDraw PRO is a unique professional vector diagramming software for business and technical drawing. Enhanced with powerful drawing tools of Mechanical Engineering solution from the Engineering area of ConceptDraw Solution Park, it is ideal for designing Technical Drawings, Electrical Schematics, Mechanical Systems Drawings, Plumbing Drawings, Structural Drawings, Architectural Drawings, Circuit Diagrams, and many other types of technical diagrams and schematics of any degree of complexity and any level of detailing. Included numerous predesigned mechanical engineering and technical drawing objects and symbols make a technical drawing process as simple as possible. Besides, ConceptDraw PRO offers extensive export capabilities that promote the active exchange of ideas and results with colleagues and other stakeholders.
 Engineering
This solution extends ConceptDraw PRO v9.4 with the ability to visualize industrial systems in electronics, electrical, chemical, process, and mechanical engineering.
 Seven Basic Tools of Quality
Manage quality control in the workplace, using fishbone diagrams, flowcharts, Pareto charts and histograms, provided by the Seven Basic Tools of Quality solution.
Electrical Symbols, Electrical Diagram Symbols
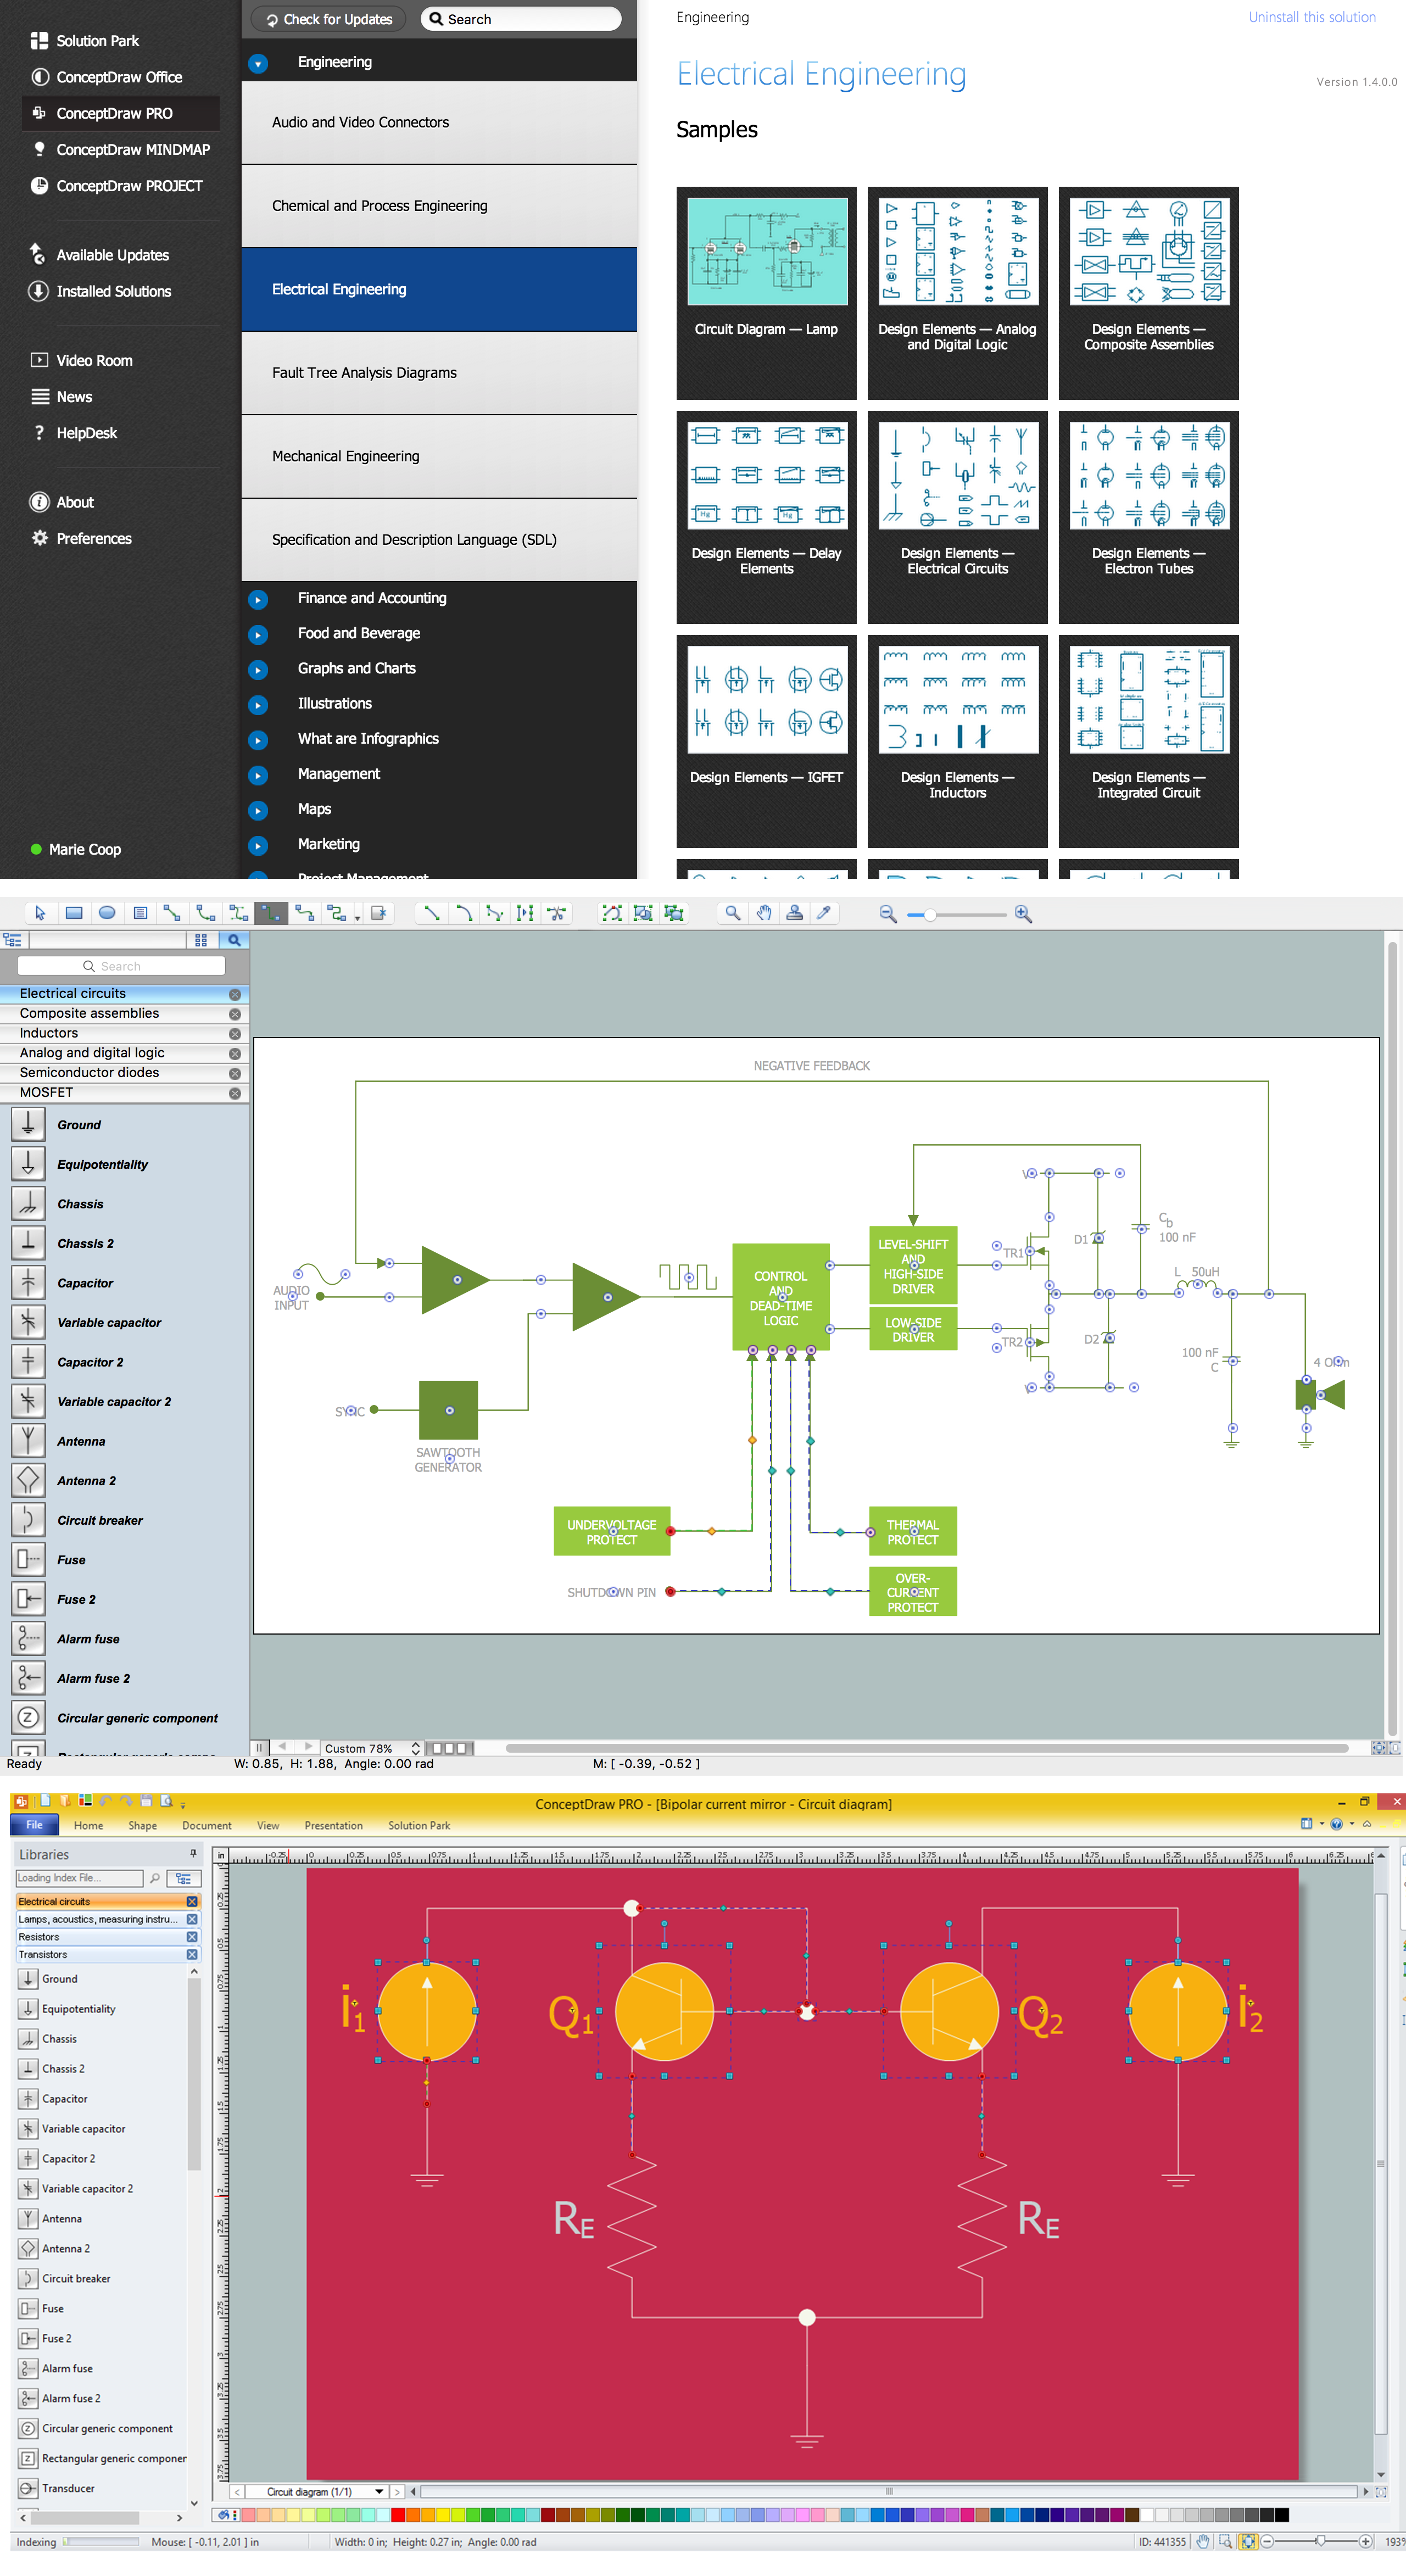
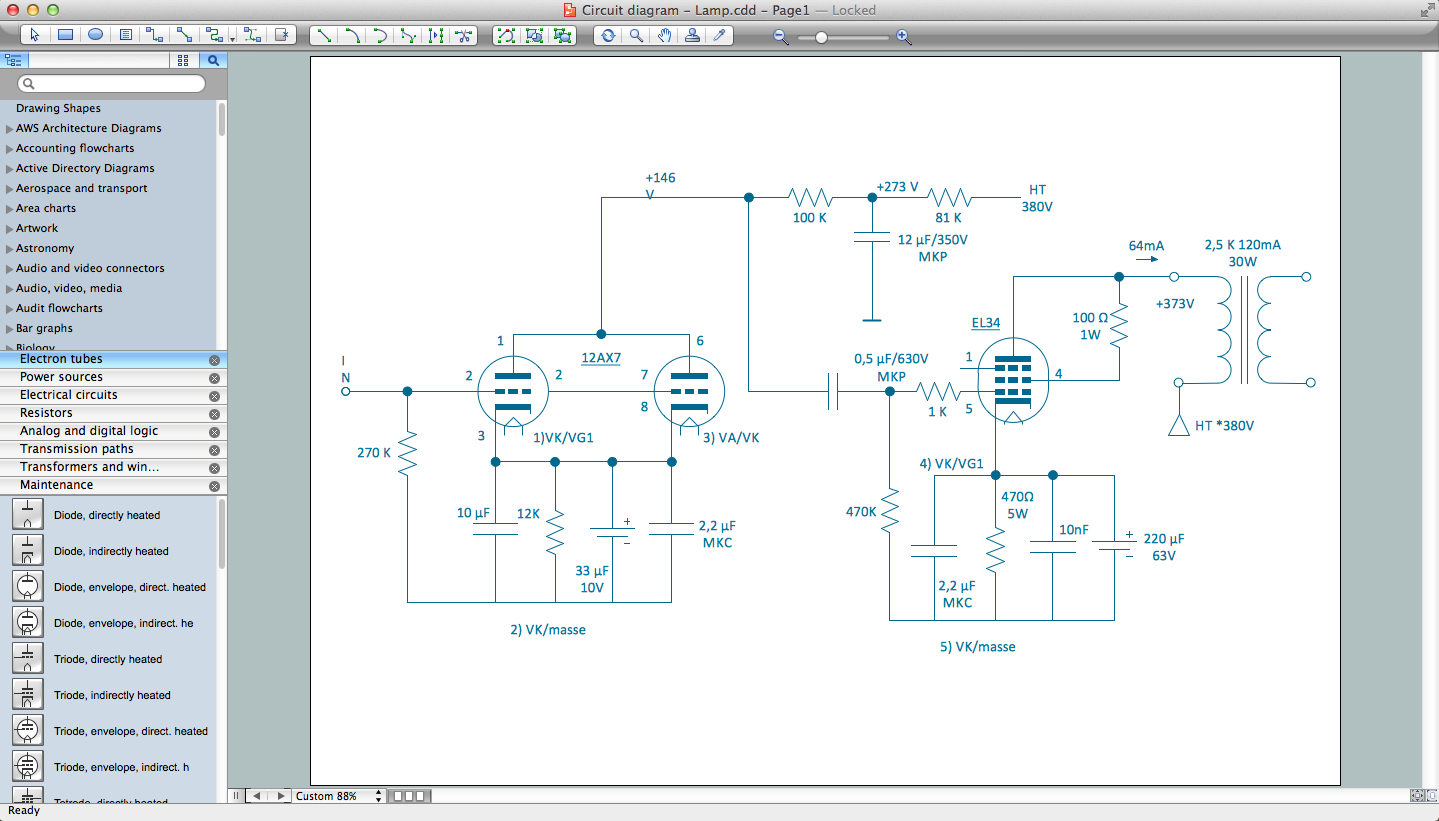
When drawing Electrical Schematics, Electrical Circuit Diagrams, Power Systems Diagrams, Circuit and Wiring Diagrams, Digital and Analog Logic Schemes, you will obligatory need the electrical symbols and pictograms to represent various electrical and electronic devices, such as resistors, wires, transistors, inductors, batteries, switches, lamps, readouts, amplifiers, repeaters, relays, transmission paths, semiconductors, generators, and many more. Today these symbols are internationally standardized, so the diagrams designed using them are recognizable and comprehensible by specialists from different countries. Electrical Engineering Solution included to ConceptDraw Solution Park provides 26 libraries with 926 commonly used electrical schematic and electrical engineering symbols making the reality the easy drawing of Electrical diagrams, schematics and blueprints. Now you need only a few minutes to create great-looking Electrical diagram, simply choose required electrical design elements from the libraries, drag them on the needed places at the document and connect in a suitable way.Wiring Diagrams with ConceptDraw PRO
A Wiring Diagram is a comprehensive schematic that depicts the electrical circuit system, shows all the connectors, wiring, signal connections (buses), terminal boards between electrical or electronic components and devices of the circuit. Wiring Diagram illustrates how the components are connected electrically and identifies the wires by colour coding or wire numbers. These diagrams are necessary and obligatory for identifying and fixing faults of electrical or electronic circuits, and their elimination. For designing Wiring Diagrams are used the standardized symbols representing electrical components and devices. ConceptDraw Solution Park offers the Electrical Engineering solution from the Engineering area with 26 libraries of graphics design elements and electrical schematic symbols for easy drawing various Wiring Diagrams, Electrical Circuit and Wiring Blueprints, Electrical and Telecom schematics of any complexity, Electrical Engineering Diagrams, Power Systems Diagrams, Repair Diagrams, Maintenance Schemes, etc. in ConceptDraw PRO software.Diagramming Software for Design UML Component Diagrams
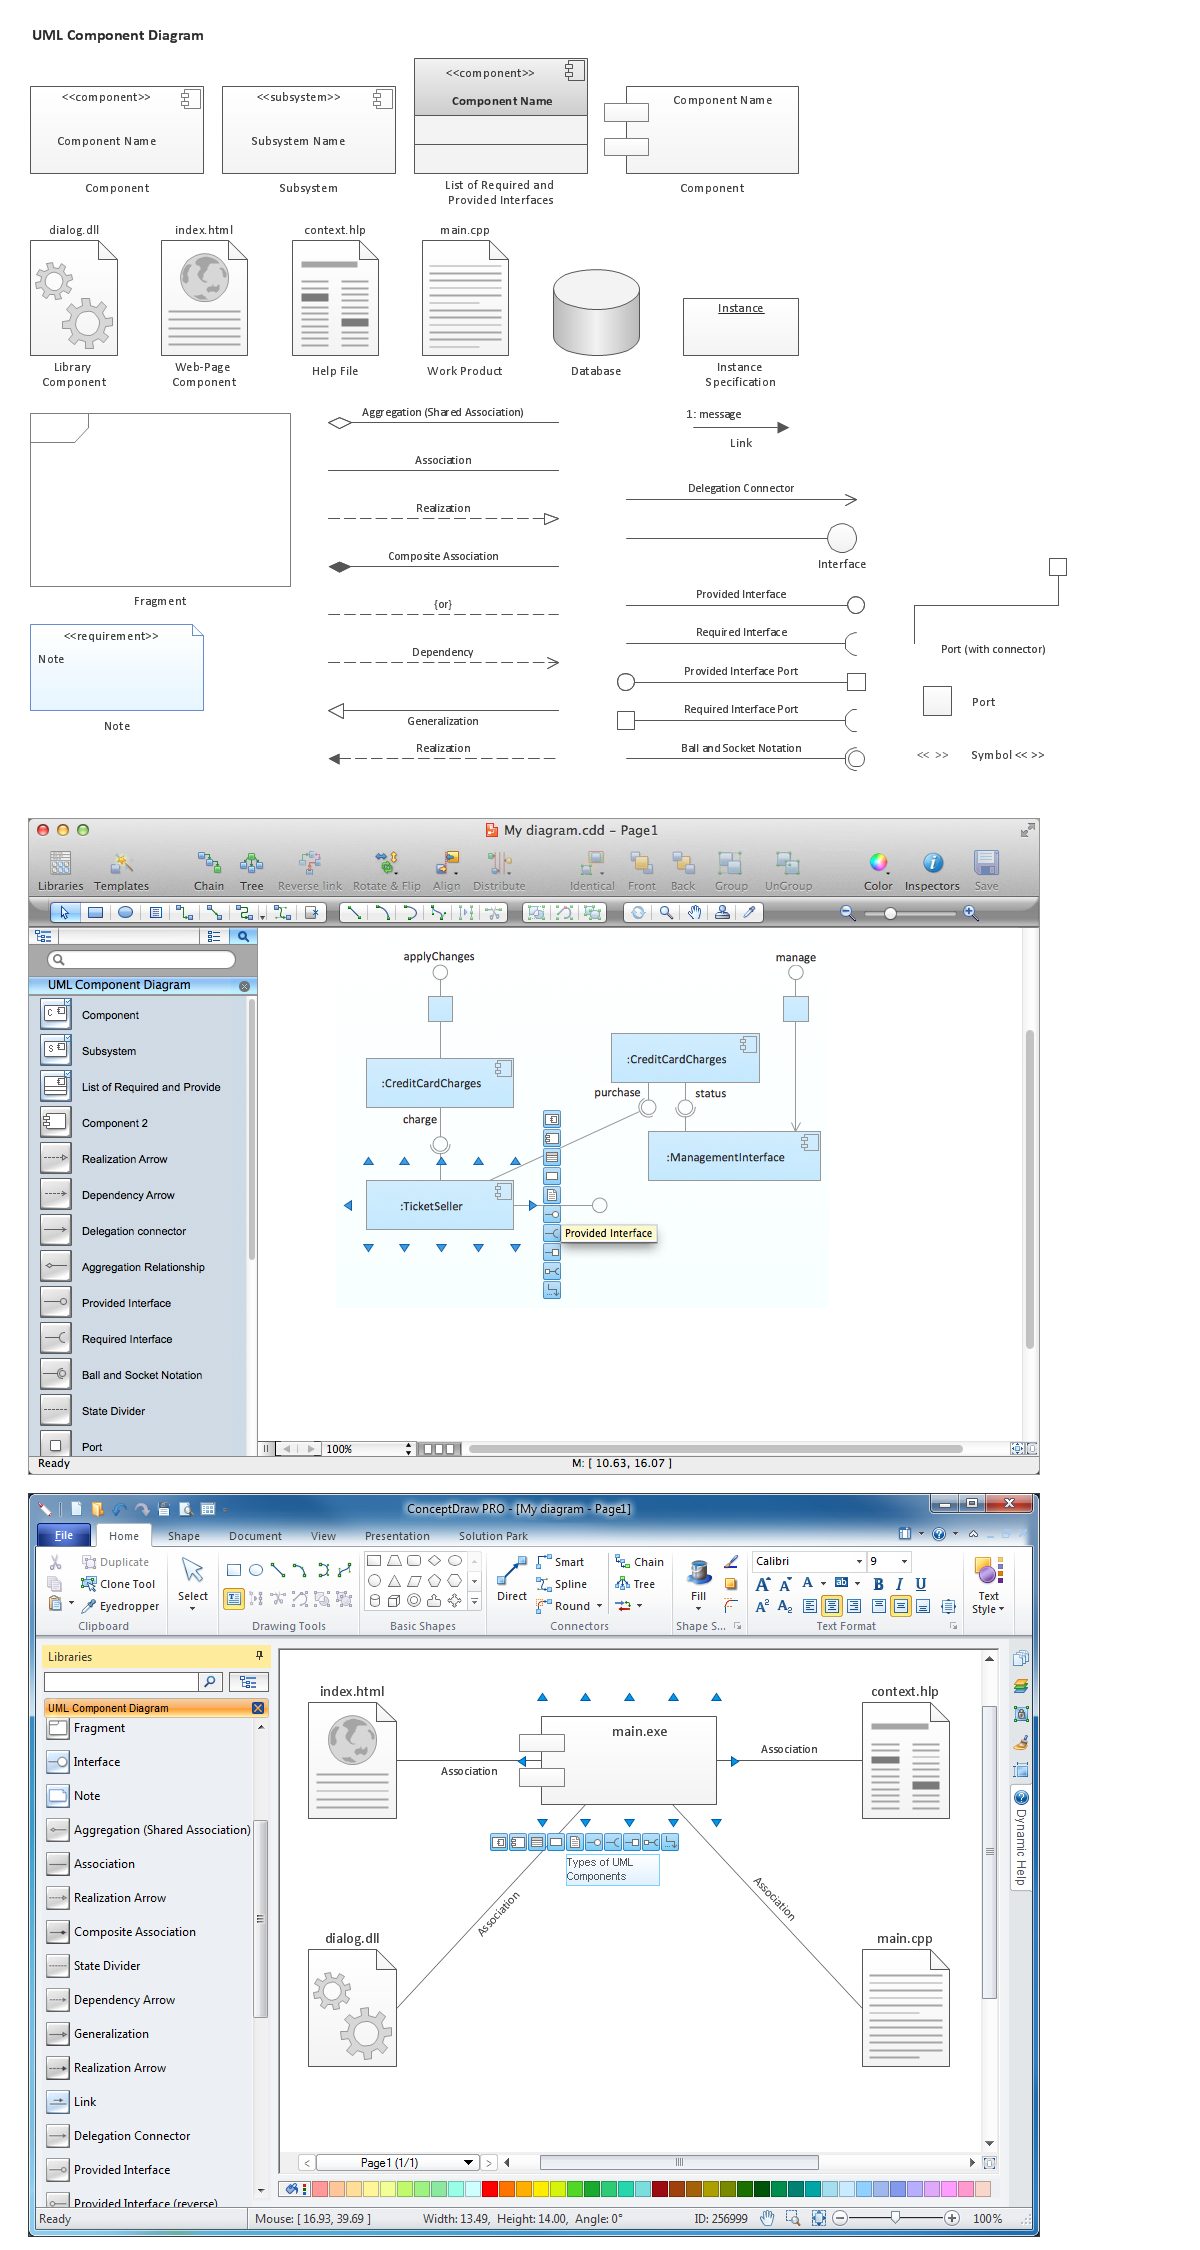
UML Component Diagram illustrate how components are wired together to larger components and software systems that shows the structure of arbitrarily complex systems. ConceptDraw Rapid UML solution delivers libraries contain pre-designed objects fit UML notation, and ready to draw professional UML Component Diagram.
 Mechanical Engineering
This solution extends ConceptDraw PRO v.9 mechanical drawing software (or later) with samples of mechanical drawing symbols, templates and libraries of design elements, for help when drafting mechanical engineering drawings, or parts, assembly, pneumatic,
Electrical Drawing Software and Electrical Symbols
Any electrical device could not be created without electrical diagram, wiring also cannot be laid without pre-designed and approved scheme or plan. Electrical drawing is a type of technical drawing that depicts scheme of some electrical device and includes the information about power, lighting, etc. Electrical plan designed for architectural or engineering project visually displays location of electrical devices and connections. ConceptDraw PRO is ideal electrical software for construction professional-looking Electrical Circuits, Electrical Schematics, Electrical Layouts, Electrical Wiring, Automotive Wiring, Cabling Layout Diagrams, Circuits and Logic Schematics, Logic Gate Diagrams, Digital Circuits, Parallel Circuits, Blue Prints with help of 926 standard electrical symbols offered by 26 libraries of Electrical Engineering solution from the Engineering area for ConceptDraw PRO. It makes drawing Electrical diagrams very easy even for beginners, and also extends your work with various export methods.UML Notation
Unified Modeling Language (UML) is an open standard, the language of graphic description used for modeling objects in a field of software development and software engineering. It was created for definition, specification, visualization, designing and documenting software systems, as a unification of three object-oriented technologies Booch, OMT and OOSE, and uses the defined graphic notation for creating the visual models of object-oriented software systems. Description of UML consists of two parts, interactive and supplementing each other: UML semantics, which represents a certain metamodel, defines the abstract syntax and semantics of terms of object modeling with UML, and UML notation that is a graphic notation for visual representation of UML semantics. The powerful tools of the Rapid UML solution included to ConceptDraw Solution Park make the ConceptDraw PRO diagramming and vector drawing software the best for easy applying the UML notation when creating the visual models of object-oriented software systems and designing different kinds of UML diagrams.- Basic Flowchart Symbols and Meaning | Flow Chart Symbols ...
- Example Of Assembly Flow Chart
- Process Flow Chart For Assembly
- Process Flowchart | Mechanical Engineering | Mechanical Drawing ...
- Process Flowchart | Cross-Functional Flowchart | Technical Drawing ...
- Process Flowchart | Technical Drawing Software | Cross-Functional ...
- Process Flowchart | Free Press Tool Design Assembly Sample ...
- How to Draw a Chemical Process Flow Diagram | How to Create a ...
- Examples Of Assembly Drawing
- Design elements - Bearings | Design elements - Pumps | Process ...
- Documents On Engineering Assembly Drawing Pdf
- Mechanical Drawing Symbols | Technical Drawing Software ...
- Engineering Drawing Assembly Example
- Mechanical Assembly Drawing Sample
- Examples Of Tools For Assembly Drawing
- Fishbone Diagram | Engineering | Mechanical Engineering | Flow ...
- Mechanical Assembly Drawing Examples
- Mechanical Drawing Symbols | Design elements - Valve assembly ...
- Mechanical Engineering | How to Create a Mechanical Diagram ...


