Design Pictorial Infographics. Design Infographics
In the course of recent decades data visualization went through significant development and has become an indispensable tool of journalism, business intelligence and science. The way visual information may be conveyed is not limited simply to static or dynamic representation, it can also be interactive. Infographics can be conditionally divided into several general levels. Primarily, this is level of visualization of information, its interpretation and association on any ground. Second level can be defined as a visualization of knowledge, depiction of thoughts and ideas in the form of images or diagrams. Finally, the level of data visualization, which processes data arrays in charts, enabling the information to be more clearly perceived. You can also identify the main approaches to the creation of infographics: exploratory and narrative. Exploratory method insists on minimalist design in favor of data precision without unnecessary details and is common for scientific researches and anaIDEF3 Standard
Use Case Diagrams technology. IDEF3 Standard is intended for description and further analysis of technological processes of an enterprise. Using IDEF3 standard it is possible to examine and model scenarios of technological processes.
 Network Layout Floor Plans
Network Layout Floor Plans solution extends ConceptDraw PRO software functionality with powerful tools for quick and efficient documentation the network equipment and displaying its location on the professionally designed Network Layout Floor Plans. Never before creation of Network Layout Floor Plans, Network Communication Plans, Network Topologies Plans and Network Topology Maps was not so easy, convenient and fast as with predesigned templates, samples, examples and comprehensive set of vector design elements included to the Network Layout Floor Plans solution. All listed types of plans will be a good support for the future correct cabling and installation of network equipment.
IDEF0 Visio
ConceptDraw PRO extended with IDEF0 Diagrams solution from the Software Development area of ConceptDraw Solution Park is a powerful diagramming and vector drawing IDEF0 software. All IDEF0 diagrams created in ConceptDraw PRO are vector graphic documents and can be reviewed, modified and converted to MS Visio XML format. To obtain the IDEF0 Visio documents from ConceptDraw PRO documents use the wide export possibilities of ConceptDraw PRO.Interior Design Office Layout Plan Design Element
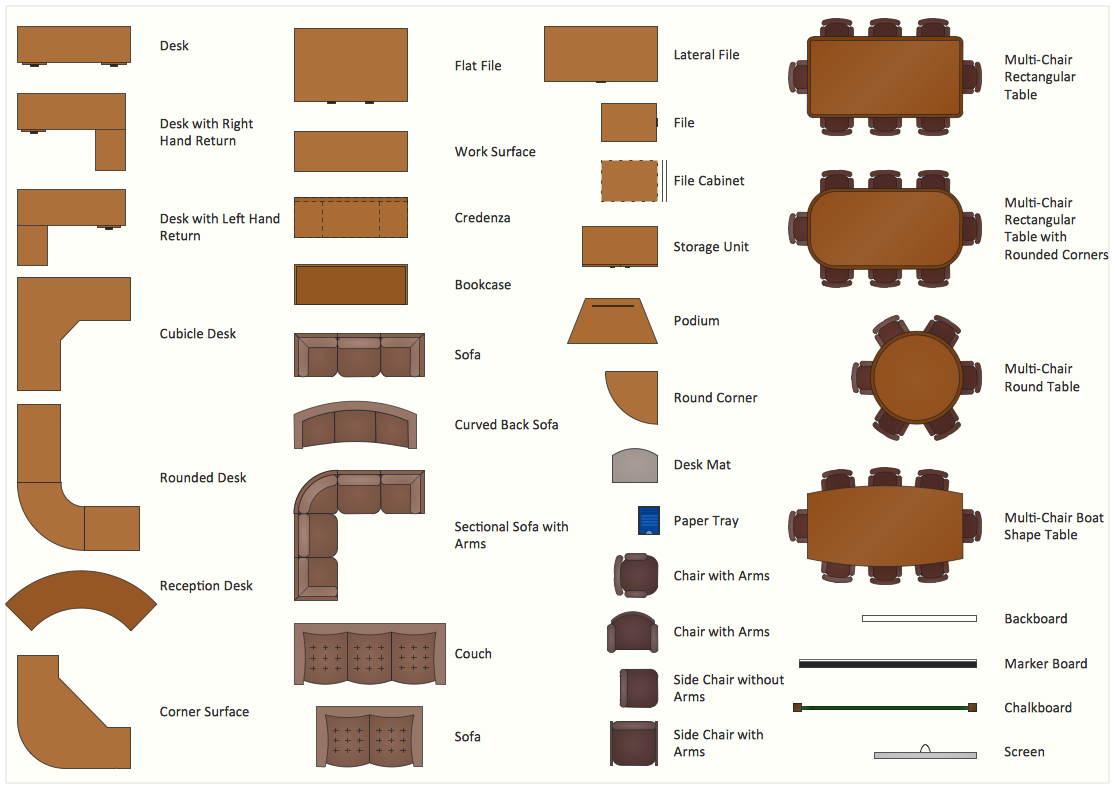
Lucky interior design is an integral part of succesful work at office. The important challenge in office design planning is to find a balance between two main office activities: concentration and communication. Primarily you need to determine with a type of office space, this can be an open space or separate rooms. The first type is more suitable for communication and rapid interaction. That's why open offices and combined spaces are modern types of work space and often used, especially for private offices. Traditional office basically represents separate rooms arranged along the corridor. It is applied for the companies with small number of people or for enterprises divided on separate departments, and is practically inapplicable for teamwork. ConceptDraw PRO diagramming and vector drawing software extended with Office Layout Plans solution offers a lot of vector stencils libraries with design elements of office furniture and equipment for effective office interior design and office space planning, for easy creation Office Floor Plans and Office Layout Plans. Use ConceptDraw PRO to visualize process flowcharts, network architecture and program workflows like Visio for Mac and even more. The software can be used with different fields like business, engineering and construction, etc.
Databases Access Objects Model with ConceptDraw PRO
ConceptDraw Basic gives the opportunity of interaction with any ODBC-compatible databases. For this the Database Access Objects Model is provided. All calls to the database are made by certain methods of objects of this model.Cross-Functional Flowchart
Use of Cross-Functional Flowchart is a clear way of showing each team member’s responsibilities and how processes get shared or transferred between different responsible people, teams and departments. Use the best flowchart maker ConceptDraw PRO with a range of standardized cross-functional flowchart symbols to create the Cross-Functional Flowcharts simply and to visualize the relationship between a business process and the functional units responsible for that process. To draw the most quickly Cross-Functional Flowcharts, Cross Functional Process Maps, or Cross Functional Process Flow Diagrams, start with a Cross-functional flowchart samples and templates from ConceptDraw Solution Park. The ConceptDraw Arrows10 and RapidDraw technologies will be also useful for you in drawing. ConceptDraw PRO supports designing both types - horizontal and vertical Cross-functional flowcharts. A vertical layout makes the accents mainly on the functional units while a horizontal layout - on the process. If you need a Visio alternative in Mac OS X, try ConceptDraw PRO. Its interface is very intuitive and it’s actually much easier to use than Visio, yet somehow it’s just as powerful if not more so. ConceptDraw PRO performs professional quality work and seamless Visio interaction.
HelpDesk
How to Draw a Pyramid Diagram in ConceptDraw PRO
Pyramid diagram (triangle diagram) is used to represent data, which have hierarchy and basics. Due to the triangular form of diagram, each pyramid section has a different width. The width of the segment shows the level of its hierarchy. Typically, the top of the pyramid is the data that are more important than the base data. Pyramid scheme can be used to show proportional and hierarchical relationships between some logically related items, such as departments within an organization, or successive elements of any process. This type of diagram is often used in marketing to display hierarchical related data, but it can be used in a variety of situations. ConceptDraw PRO allows you to make a pyramid diagram, quickly and easily using special libraries.IDEF0 standard with ConceptDraw PRO
The activity of any organization is more or less branchy network of processes. The description of these processes is a hard technical task which requires definite methodology and standards. According to the IDEF0 standard any process can be described in the form of a block (Activity Box) which has inputs and outputs. The process consists in transformation of inputs into outputs under the influence of the management and in the presence of necessary resources. Outputs of the given process later on can be either inputs for the next process or resources, or management means.How to draw Metro Map style infographics? Moscow, New York, Los Angeles, London
The solution handles designs of any complexity, and the comprehensive library covers all key aspects of a transportation system. To further enhance your map design, there is the option to embed links, that can display station images or other relevant, important information. We have also included a set of samples in the solution, that show the possible real-world application — complex tube systems including the London Tube and New York City Subway show the level of detail possible when using the Metro Map Solution.HelpDesk
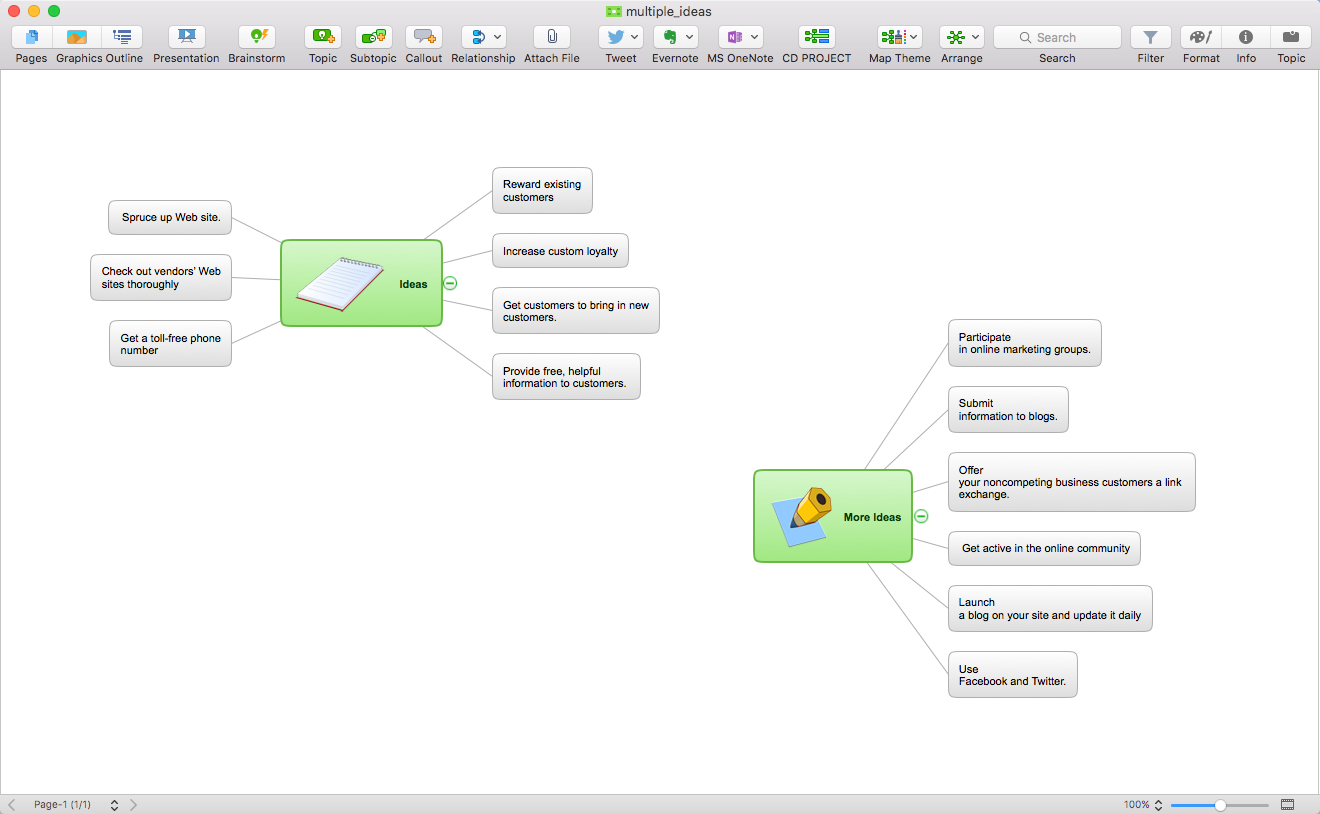
How to Operate a Multiple Main Idea on Your Mind Map
If you are using multiple Main Ideas your maps, it is necessary to know that there is a difference in behavior between the original primary Main Idea and the other Ideas you add.- Data Flow Diagram For Online Shopping System Level 0 1 2
- Data Flow Diagram
- Pyramid Diagram | 4 Level pyramid model diagram - Information ...
- Sales Process Map | UML Component Diagram Example - Online ...
- Example of DFD for Online Store ( Data Flow Diagram ) DFD ...
- Diagram Related To Knowledge Information Systems
- Shopping Order Form Template
- UML Class Diagram Example - Medical Shop | Online Diagram Tool ...
- UML Class Diagram Example - Medical Shop | Class Diagram Tool ...
- Store Layout Software | Example of DFD for Online Store ( Data Flow ...
- 4 Level pyramid model diagram - Information systems types | 5 Level ...
- UML class diagram - Metadata information model | Express-G ...
- Basic Flowchart Symbols and Meaning | DFD Flowchart Symbols ...
- Basic Flowchart Symbols and Meaning | Design Pictorial ...
- UML Class Diagram Example - Medical Shop
- 4 Level pyramid model diagram - Information systems types ...
- Shopping Workflow
- Online Medical Helpline Data Flowchart Diagram
- Flow Chart Symbols | Swim Lane Flowchart Symbols | How To ...
- Basic Flowchart Symbols and Meaning | Types of Flowchart ...


