"Metadata is "data about data". The term is ambiguous, as it is used for two fundamentally different concepts (types). Structural metadata is about the design and specification of data structures and is more properly called "data about the containers of data"; descriptive metadata, on the other hand, is about individual instances of application data, the data content.
Metadata are traditionally found in the card catalogs of libraries. As information has become increasingly digital, metadata are also used to describe digital data using metadata standards specific to a particular discipline. By describing the contents and context of data files, the quality of the original data/ files is greatly increased. For example, a webpage may include metadata specifying what language it is written in, what tools were used to create it, and where to go for more on the subject, allowing browsers to automatically improve the experience of users." [Metadata. Wikipedia]
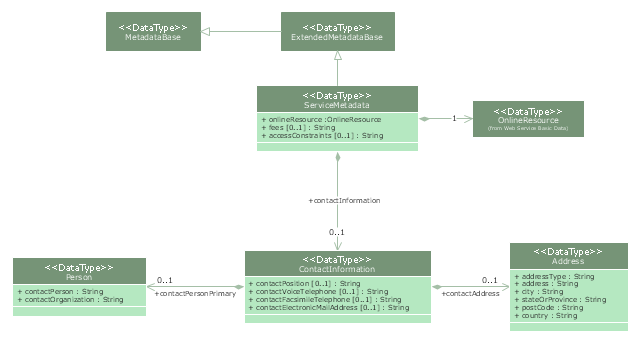
The UML class diagram example "Metadata information model" was created using the ConceptDraw PRO diagramming and vector drawing software extended with the Rapid UML solution from the Software Development area of ConceptDraw Solution Park.
Metadata are traditionally found in the card catalogs of libraries. As information has become increasingly digital, metadata are also used to describe digital data using metadata standards specific to a particular discipline. By describing the contents and context of data files, the quality of the original data/ files is greatly increased. For example, a webpage may include metadata specifying what language it is written in, what tools were used to create it, and where to go for more on the subject, allowing browsers to automatically improve the experience of users." [Metadata. Wikipedia]
The UML class diagram example "Metadata information model" was created using the ConceptDraw PRO diagramming and vector drawing software extended with the Rapid UML solution from the Software Development area of ConceptDraw Solution Park.
UML class diagram
A four level pyramid model of different types of Information Systems based on the different levels of hierarchy in an organization. The first level represents transaction processing systems for workers. The second level represents management information systems for middle managers. The third level represents decision support systems for senior menegers. The fourth level represents executive information systems for executives.
"The "classic" view of Information systems found in the textbooks in the 1980s was of a pyramid of systems that reflected the hierarchy of the organization, usually transaction processing systems at the bottom of the pyramid, followed by management information systems, decision support systems, and ending with executive information systems at the top. Although the pyramid model remains useful, since it was first formulated a number of new technologies have been developed and new categories of information systems have emerged, some of which no longer fit easily into the original pyramid model.
Some examples of such systems are:
data warehouses,
enterprise resource planning,
enterprise systems,
expert systems,
search engines,
geographic information system,
global information system,
office automation." [Information systems. Wikipedia]
This diagram was redesigned using the ConceptDraw PRO diagramming and vector drawing software from Wikimedia Commons file Four-Level-Pyramid-model.png. [commons.wikimedia.org/ wiki/ File:Four-Level-Pyramid-model.png]
This file is licensed under the Creative Commons Attribution-Share Alike 3.0 Unported license. [creativecommons.org/ licenses/ by-sa/ 3.0/ deed.en]
The triangle chart example "Information systems types" is included in the Pyramid Diagrams solution from the Marketing area of ConceptDraw Solution Park.
Pyramid diagram

A five level pyramid model of different types of Information Systems based on the information processing requirement of different levels in the organization. The first level represents transaction processing systems to process basic data. The second level represents office support systems to process information in office. The third level represents management information systems to process information by managers. The fourth level represents decision support systems to process explicit knowledge. The fifth level represents executive information systems to process tacit knowledge.
"A Computer(-Based) Information System is essentially an IS using computer technology to carry out some or all of its planned tasks. The basic components of computer based information system are:
(1) Hardware - these are the devices like the monitor, processor, printer and keyboard, all of which work together to accept, process, show data and information.
(2) Software - are the programs that allow the hardware to process the data.
(3) Databases - are the gathering of associated files or tables containing related data.
(4) Networks - are a connecting system that allows diverse computers to distribute resources.
(5) Procedures - are the commands for combining the components above to process information and produce the preferred output.
The first four components (hardware, software, database and network) make up what is known as the information technology platform. Information technology workers could then use these components to create information systems that watch over safety measures, risk and the management of data. These actions are known as information technology services." [Information systems. Wikipedia]
This pyramid diagram was redesigned using the ConceptDraw PRO diagramming and vector drawing software from Wikimedia Commons file Five-Level-Pyramid-model.png. [commons.wikimedia.org/ wiki/ File:Five-Level-Pyramid-model.png]
This file is licensed under the Creative Commons Attribution 3.0 Unported license. [creativecommons.org/ licenses/ by/ 3.0/ deed.en]
The triangle chart example "Information systems types" is included in the Pyramid Diagrams solution from the Marketing area of ConceptDraw Solution Park.
Pyramid diagram

Data modeling with ConceptDraw PRO

HelpDesk
Accounting Information Systems Flowchart Symbols

- UML Diagram | UML class diagram - Metadata information model ...
- UML class diagram - Metadata information model | Meta Data In Ooad
- UML class diagram - Metadata information model | UML Diagram ...
- Data Flow Diagrams | UML class diagram - Metadata information ...
- UML class diagram - Metadata information model | How to create a ...
- UML class diagram - Metadata information model | Data Flow ...
- 4 Level pyramid model diagram - Information systems types ...
- UML class diagram - Metadata information model | Rapid UML ...
- UML class diagram - Metadata information model | UML Sample ...
- UML class diagram - Metadata information model
- Wireframe Tools | Wireframe Examples | UML class diagram ...
- Pyramid Diagram | 4 Level pyramid model diagram - Information ...
- 4 Level pyramid model diagram - Information systems types | Model ...
- Chart Of Management Information System With Diagram
- 5 Level pyramid model diagram - Information systems types ...
- Pyramid Diagram | 5 Level pyramid model diagram - Information ...
- Data flow Model Diagram
- Data Flow Diagram | 5 Level pyramid model diagram - Information ...
- Process Flowchart | Data Flow Diagram | 5 Level pyramid model ...