Gant Chart in Project Management


Different Segments of An EPC
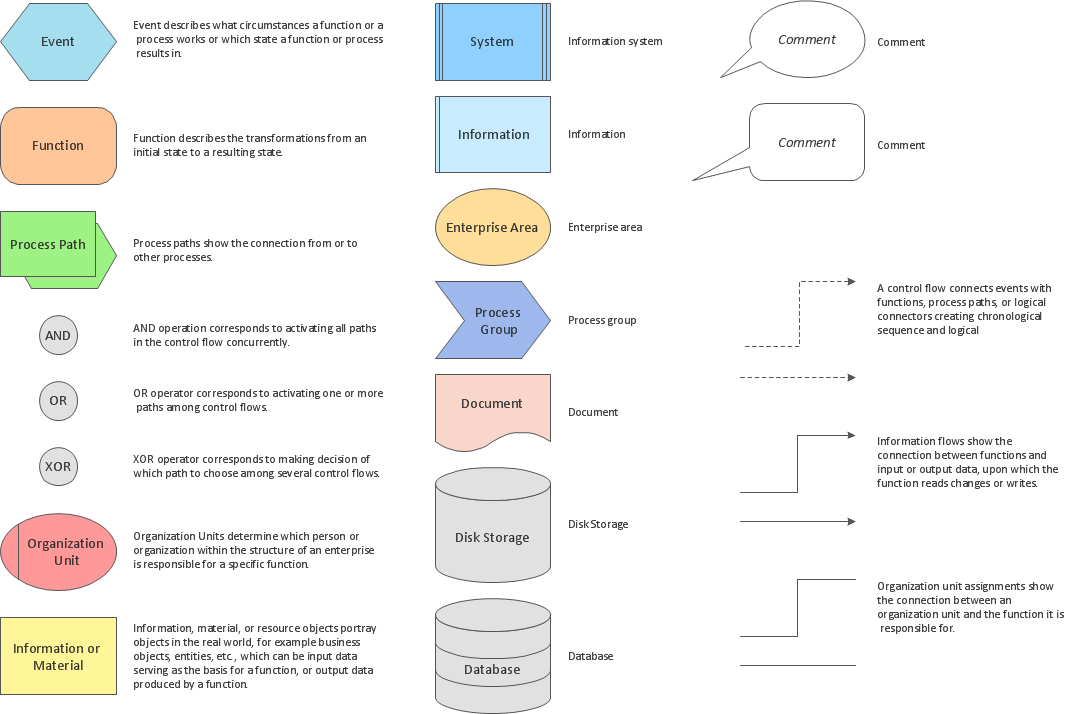
The vector stencils library "IDEF0" contains 26 IDEF0 diagram symbols.
Use it for business process modeling with IDEF0 diagrams.
"The IDEF0 model ... is based on a simple syntax. Each activity is described by a verb-based label placed in a box. Inputs are shown as arrows entering the left side of the activity box while output are shown as exiting arrows on the right side of the box. Controls are displayed as arrows entering the top of the box and mechanisms are displayed as arrows entering from the bottom of the box. Inputs, Controls, Outputs, and Mechanisms are all referred to as concepts.
- Arrow: A directed line, composed of one or more arrow segments, that models an open channel or conduit conveying data or objects from source (no arrowhead) to use (with arrowhead). There are 4 arrow classes: Input Arrow, Output Arrow, Control Arrow, and Mechanism Arrow (includes Call Arrow). See Arrow Segment, Boundary Arrow, Internal Arrow.
- Box: A rectangle, containing a name and number, used to represent a function.
- Context: The immediate environment in which a function (or set of functions on a diagram) operates.
- Decomposition: The partitioning of a modeled function into its component functions.
- Fork: The junction at which an IDEF0 arrow segment (going from source to use) divides into two or more arrow segments. May denote unbundling of meaning.
- Function: An activity, process, or transformation (modeled by an IDEF0 box) identified by a verb or verb phrase that describes what must be accomplished.
- Join: The junction at which an IDEF0 arrow segment (going from source to use) merges with one or more other arrow segments to form a single arrow segment. May denote bundling of arrow segment meanings.
- Node: A box from which child boxes originate; a parent box. See Node Index, Node Tree, Node Number, Node Reference, Diagram Node Number." [IDEF0. Wikipedia]
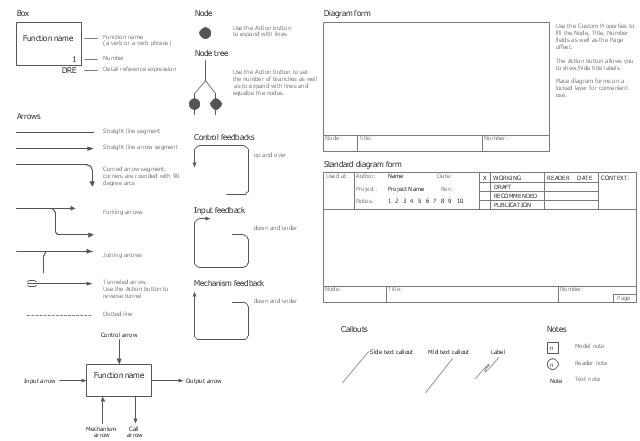
The shapes example "Design elements - IDEF0" was created using the ConceptDraw PRO diagramming and vector drawing software extended with the solution "IDEF Business Process Diagrams" from the area "Business Processes" of ConceptDraw Solution Park.
Use it for business process modeling with IDEF0 diagrams.
"The IDEF0 model ... is based on a simple syntax. Each activity is described by a verb-based label placed in a box. Inputs are shown as arrows entering the left side of the activity box while output are shown as exiting arrows on the right side of the box. Controls are displayed as arrows entering the top of the box and mechanisms are displayed as arrows entering from the bottom of the box. Inputs, Controls, Outputs, and Mechanisms are all referred to as concepts.
- Arrow: A directed line, composed of one or more arrow segments, that models an open channel or conduit conveying data or objects from source (no arrowhead) to use (with arrowhead). There are 4 arrow classes: Input Arrow, Output Arrow, Control Arrow, and Mechanism Arrow (includes Call Arrow). See Arrow Segment, Boundary Arrow, Internal Arrow.
- Box: A rectangle, containing a name and number, used to represent a function.
- Context: The immediate environment in which a function (or set of functions on a diagram) operates.
- Decomposition: The partitioning of a modeled function into its component functions.
- Fork: The junction at which an IDEF0 arrow segment (going from source to use) divides into two or more arrow segments. May denote unbundling of meaning.
- Function: An activity, process, or transformation (modeled by an IDEF0 box) identified by a verb or verb phrase that describes what must be accomplished.
- Join: The junction at which an IDEF0 arrow segment (going from source to use) merges with one or more other arrow segments to form a single arrow segment. May denote bundling of arrow segment meanings.
- Node: A box from which child boxes originate; a parent box. See Node Index, Node Tree, Node Number, Node Reference, Diagram Node Number." [IDEF0. Wikipedia]
The shapes example "Design elements - IDEF0" was created using the ConceptDraw PRO diagramming and vector drawing software extended with the solution "IDEF Business Process Diagrams" from the area "Business Processes" of ConceptDraw Solution Park.
IDEF0 diagram symbols
The vector stencils library "Toolbar control elements" contains 42 toolbar graphical control elements.
Use this tool bar control element UI icon set to design graphic user interface (GUI) of your software application for OS X 10.10 Yosemite Apple Mac operating system.
The example "Toolbar control elements - Vector stencils library" was created using the ConceptDraw PRO diagramming and vector drawing software extended with the Mac OS User Interface solution from the Software Development area of ConceptDraw Solution Park.
Drop-down button

Drop-down button - ON press left

Drop-down button - ON press right

Tool bar button

Tool bar button - ON press

Tool bar button - selected

Left segment

Left segment - ON press

Left segment - selected

Middle segment

Middle segment - ON press

Middle segment - selected

Right segment

Right segment - ON press

Right segment - selected

Segmented control - 2 buttons

Segmented control - 3 buttons

Segmented control - 4 buttons

Small button toggle

Back - Forward button

List/Icons view control
Arrange button

Action menu

Downloads button

Copy button

Share button

Edit tags button

Sidebar button

Slider element

Tool bar button 2

Tool bar button 2 - ON press

Tool bar button 2 - selected

Search field

Search field - active

"Stoplights" control
Close button

Minimize button

Maximize button

Close button - hover

Minimize button - hover

Maximize button - hover

Action button - inactive

How To Create Onion Diagram

The vector stencils library "General window elements" contains 31 window elements.
Use this window UI icon set to design graphic user interface (GUI) of your software application for OS X 10.10 Yosemite Apple Mac operating system.
The example "General window elements - Vector stencils library" was created using the ConceptDraw PRO diagramming and vector drawing software extended with the Mac OS User Interface solution from the Software Development area of ConceptDraw Solution Park.
Main app window area

Main sidebar

Window panel

General slider

Volume slider

Audio level
Divider line

Scroll bar

Text label

Radio button

Radio button - selected

Check box

Check box - selected

Stepper control

Disclosure button - point down

Disclosure button - point up

Help button

Add / subtract accounts

Text field

Text field - selected

Push button

Push button - active

Pop-up menu

Group box

Image well

Left segment button

Center segment button

Right segment button

Left segment button - active

Center segment button - active

Right segment button - active

"A bus network is a network topology in which nodes are connected in a daisy chain by a linear sequence of buses. ...
The bus is the data link in a bus network. The bus can only transmit data in one direction, and if any network segment is severed, all network transmission ceases.
A host on a bus network is called a station or workstation. In a bus network, every station receives all network traffic, and the traffic generated by each station has equal transmission priority. Each network segment is, therefore, a collision domain. In order for nodes to transmit on the same cable simultaneously, they use a media access control technology such as carrier sense multiple access (CSMA) or a bus master." [Bus network. Wikipedia]
The bus network topology diagram example was created using the ConceptDraw PRO diagramming and vector drawing software extended with the Computer and Networks solution from the Computer and Networks area of ConceptDraw Solution Park.
Bus topology

Competitor Analysis

Line Graph

Network Glossary Definition


Metropolitan area networks (MAN). Computer and Network Examples
. Computer and Network Examples")
HelpDesk
How to Create a Venn Diagram

Project —Task Trees and Dependencies

HelpDesk
How to Connect Objects on PC

- Networking Equipment Images Png Hd
- Drop Vector Png
- Personal Profile Png
- Interactive Voice Response Diagrams | VoIP call with SIM box and ...
- 3d Pyramid With 5 Levels Png
- Exporting ConceptDraw PRO document to . PNG , .JPG, or other ...
- Interactive Voice Response Diagrams | VoIP call with SIM box and ...
- Sample Product Label Design Png
- Bar Icons Png
- IVR systems architecture | Interactive Voice Response Diagrams ...
- Instagram Vector Png
- Point Png
- What Is A Example Of Local Areea Network In Png
- Flowchart Marketing Process. Flowchart Examples | Marketing ...
- Percentage Chart Png
- IVR Systems | IVR systems architecture | Interactive Voice Response ...
- Tags Png
- Office Furniture Top View Png
- Box Png Images
- IDEF0 diagram - Inter-box connections | VoIP call with SIM box and ...