Different Segments of An EPC
Event-driven Process Chain Diagrams
ConceptDraw DIAGRAM is a software for making EPC diagrams that allows managers visually present business process models for making decisions for business processes improvement. ConceptDraw DIAGRAM with includes tools that are specifically designed to facilitate the process of depicting business processes.
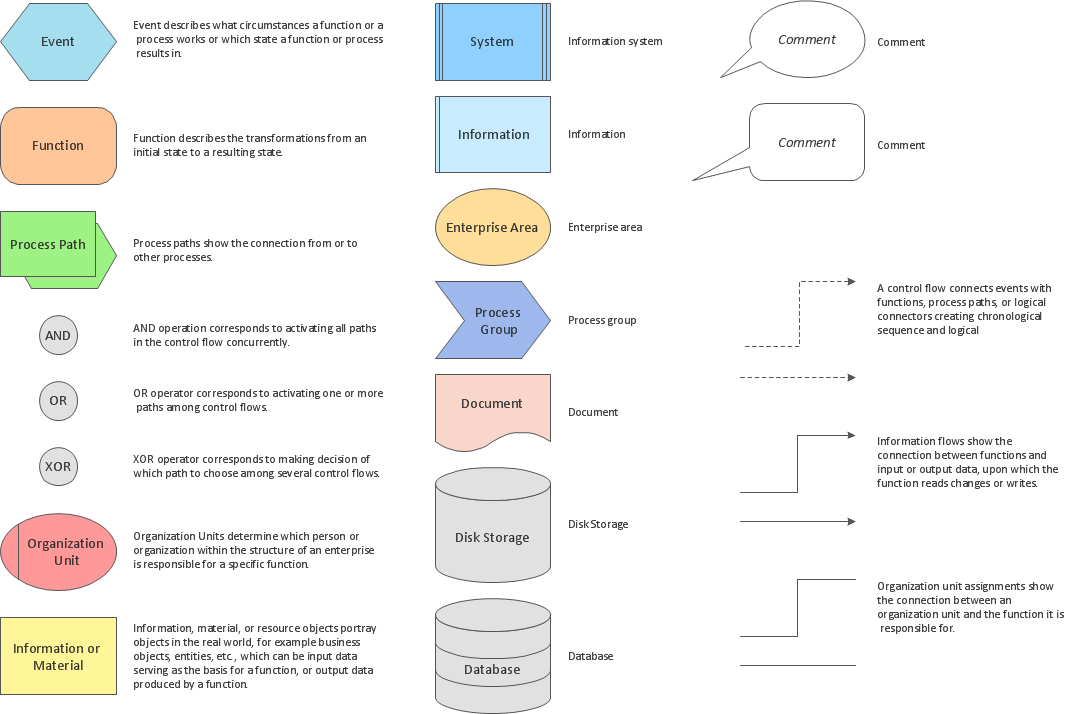
Pic.1 Design elements for EPC diagrams.
Stencil library EPC Diagram Shapes from Event-driven Process Chain Diagrams solution provides 23 vector design elements for drawing event-driven process chain diagrams.
Use design elements from the EPC Diagram Shapes library for drawing your EPC diagrams to plan resources and improve business processes.
THREE RELATED HOW TO's:
It’s very easy, quick and convenient to draw the Event-driven Process Chain (EPC) diagrams in ConceptDraw DIAGRAM diagramming and vector drawing software using the Event-driven Process Chain Diagrams Solution from the Business Processes area of ConceptDraw Solution Park.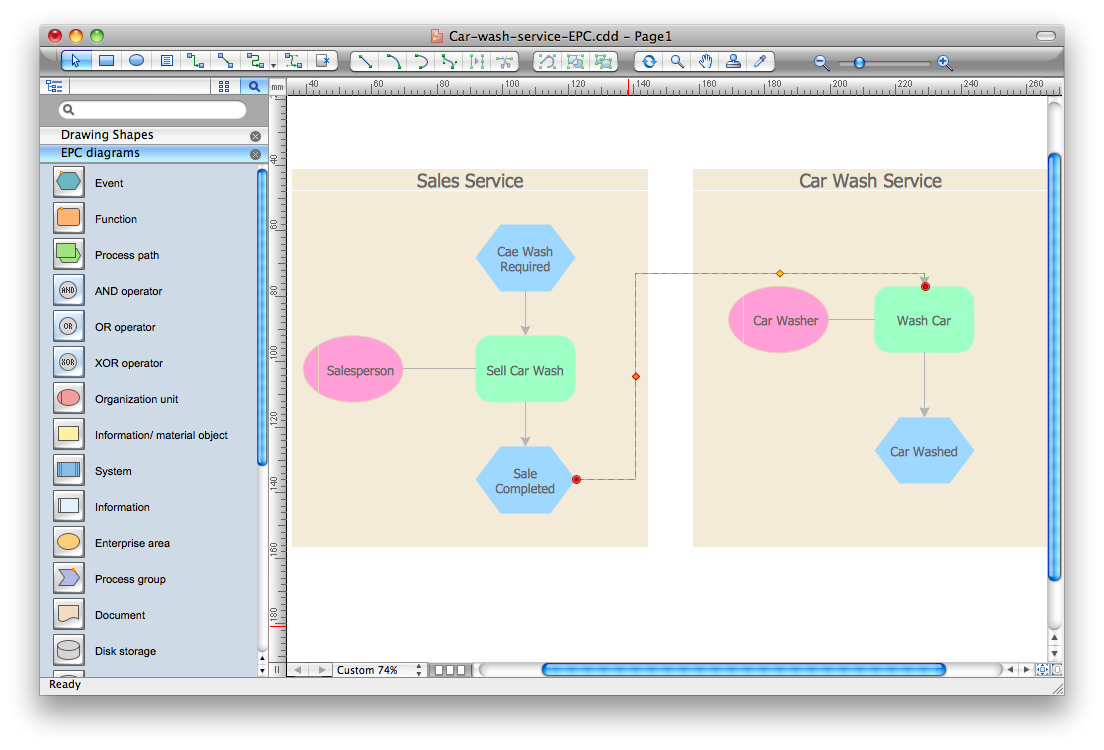
Picture: Event-Driven Process Chain Diagram Software
Related Solution:
The vector stencils library SSADM from the solution Systems engineering contains specific symbols of SSADM diagrams for ConceptDraw DIAGRAM software.
Picture: SSADM Diagram
Unified Modeling Language (UML) is a language of graphic description for object modeling in the field of software engineering. UML was created for definition, visualization, designing of software systems. UML is an open standard that uses graphic notations for creating visual models of object-oriented software systems.
The Rapid UML Solution for ConceptDraw DIAGRAM presentsthe intuitive RapidDraw interface that helps you to make the UML Diagram of any of these 13 types quick and easy.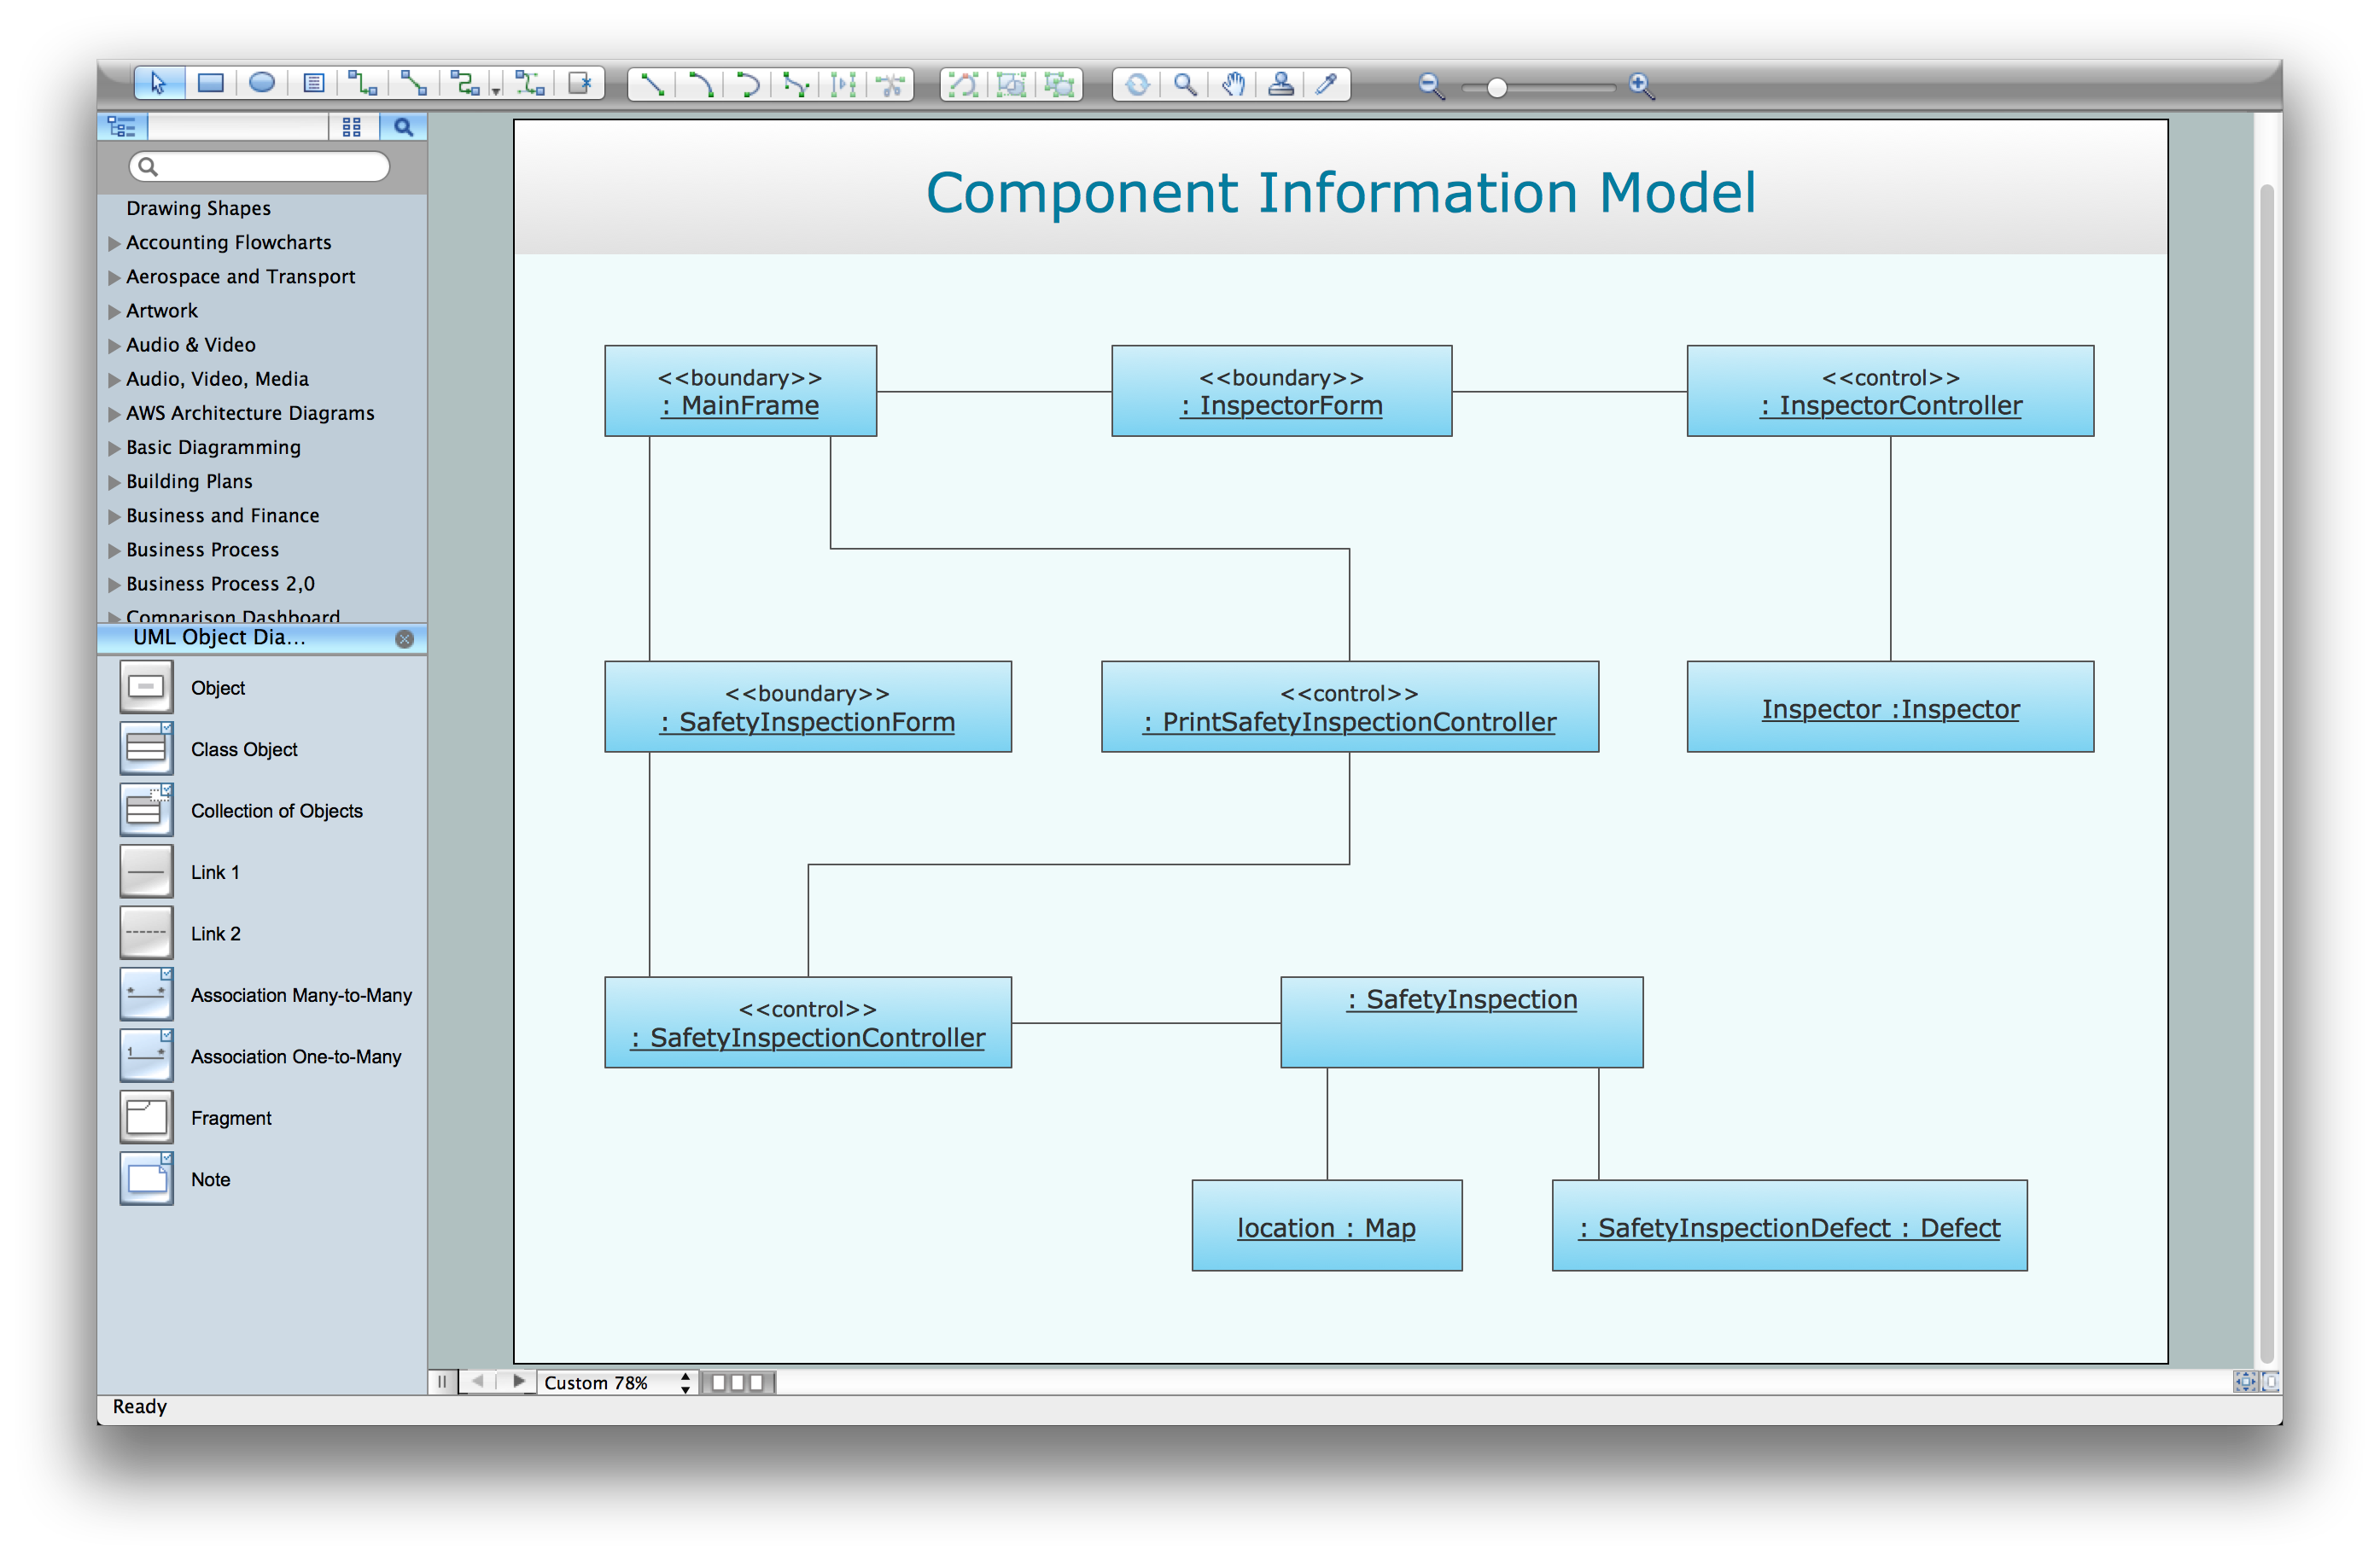
Picture: UML Software
Related Solution:
ConceptDraw
DIAGRAM 18