Competitor Analysis

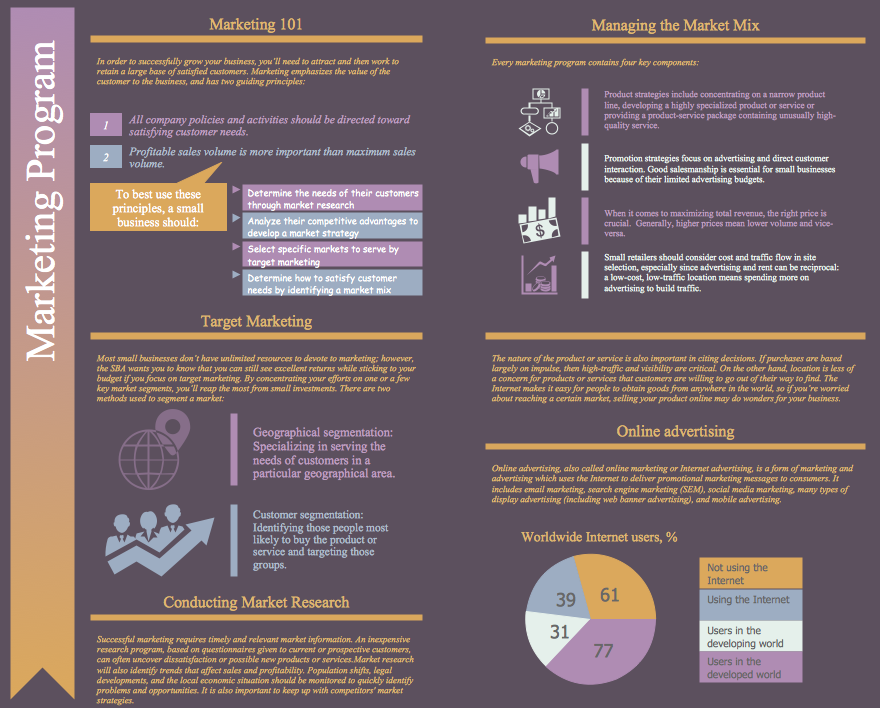
Marketing Plan Infographic
Financial Comparison Chart

Basic Flowchart Examples

Bar Chart Template for Word

Pie Donut Chart. Pie Chart Examples

Relative Value Chart Software

Pyramid Diagram and Pyramid Chart

Rainfall Bar Chart

Pyramid Chart Examples

 ConceptDraw Solution Park
ConceptDraw Solution Park collects graphic extensions, examples and learning materials
Circle Diagrams

Circle Spoke Diagram Template

 SWOT and TOWS Matrix Diagrams
SWOT and TOWS Matrix Diagrams solution extends ConceptDraw DIAGRAM and ConceptDraw MINDMAP software with features, templates, samples and libraries of vector stencils for drawing SWOT and TOWS analysis matrices and mind maps.
Donut Chart Templates

- Create Market Analysis Pie Template
- Feature Comparison Chart Software | Marketing Flow Chart ...
- Flow Chart of Marketing Analysis
- What Do You Include In A Market Analysis Pie Chart
- How To Write A Market Analysis Pie Chart
- Market Analysis Pie
- Design elements - Marketing charts | Marketing Flow Chart ...
- Flowchart Example: Flow Chart of Marketing Analysis | Process ...
- How to Draw the Different Types of Pie Charts | How to Draw a Pie ...
- Pyramid Diagram and Pyramid Chart | Six Markets Model Chart ...
- Feature Comparison Chart Software | Marketing | How to Make ...
- Marketing Flow Chart | Matrices | Competitor Analysis | A Drawing Of ...
- How to Draw a Pie Chart Using ConceptDraw PRO | Content ...
- Content marketing cycle - Diamond pie chart | Process Flowchart ...
- Market Analysis Pie Chart
- Market Chart | Six Markets Model Chart | Process Flowchart | Easy ...
- Pyramid Diagram and Pyramid Chart | How to Draw a Pie Chart ...
- Market Survey Through Bar Graph And Pie Chart
- Marketing Charts | Design elements - Marketing charts | Market ...
- Pie Chart Software | How to Draw the Different Types of Pie Charts ...