This site uses cookies. By continuing to browse the ConceptDraw site you are agreeing to our Use of Site Cookies.

Risk Diagram (Process Decision Program Chart)

Process Decision Program Chart (PDPC) is a commonly used technique that was designed in order to help prepare the contingency plans. The emphasis of the PDPC is identifying the consequential impact of failure on activity plans as well as creating the appropriate contingency plans in terms of limiting the risks. Planning to make the tree diagrams and/or the process diagrams can be extended by a couple of levels when the PDPC can be applied to the bottom level tasks on those diagrams.
HelpDesk

How to Draw a Decision-Making Diagram

The Decision-Making solution provides ConceptDraw DIAGRAM users with vector libraries, containing a full set of flowchart symbols. Also, it offers a number of templates and samples, making short work of creating a graphical view of decision-making processes.

Risk Diagram (Process Decision Program Chart)

Analyze each identified action separately in the tree of all actions and then develop a preventive action in response to potential obstacles or circumstances have been identified as a risk.
The PDPC determines the risks when corrective action is not performed correctly. Also, it helps develop descriptions for preventive actions at the level of execution.

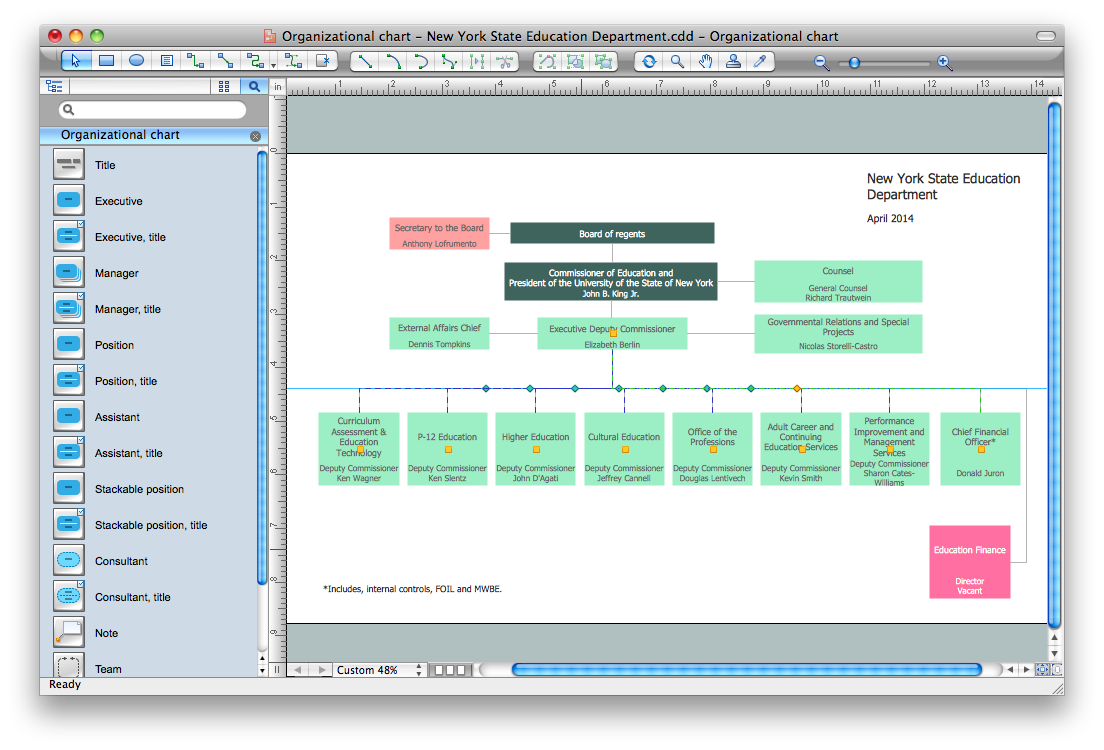
Organization Chart Software

Create Organizational Chart Software - You need create Organizational Chart? Nothing could be easier with ConceptDraw DIAGRAM diagramming and vector drawing software. ConceptDraw DIAGRAM presents the Organizational Charts Solution from the Management Area that will allow you to draw the Organization Charts of any difficulty easy and quick.
How to draw an Organizational Chart

Flow Chart Symbols

Flowcharts are used in designing and documenting simple processes or programs. Like other types of diagrams, they help visualize what is going on and thereby help understand a process, and perhaps also find flaws, bottlenecks, and other less-obvious features within it. There are many different types of flowcharts, and each type has its own repertoire of boxes and notational conventions.
Flowchart diagrams consists of symbols of process, decision, data and document, data base, termination or initiation processes, processing loops and conditions. To create an drawn flowchart use professional flowchart maker of ConceptDraw DIAGRAM.

Workflow Diagram

Workflow diagram visually describes an repeatable pattern of organizational activity powered by resources. Workflow diagram explains and document the process flow which needs to be organized or exists and needs to be learned and executed. Workflow diagram can be part of project documentation, company policies or sertification process to comply a standard.

The workflow represents the transferring of data, documents or tasks during a work process. To make it easier to study and analyze working processes, and to present them in a simple visual manner, workflow diagrams are used. To create these diagrams professional use workflow diagram maker software ConceptDraw DIAGRAM.

How To Make the Right Decision in Projects

A key point of conference success is the ability to see slides in real time, and hold documented discussions during the meeting. Remote Presentation for Skype is a new solution allows real-time presenting that benefits work groups who need collaborate by web meetings.

Pyramid Diagram

A three level pyramid model of different types of Information Systems based on the type of decisions taken at different levels in the organization.

Flowchart Components

The ConceptDraw Flowchart component includes a set of samples and templates. This geathered as flowchart maker toolbox which focused on drawing flowcharts of any industry standards.
HelpDesk

How to Draw a Matrix Organizational Chart

There are a number of moments which are influenced by how the organizational structure of a certain business needs to be, how complex, and which type it should keep. The matrix organizational structure is atypical because it brings together employees and managers from different departments to work toward accomplishing a goal. This structure is commonly found in businesses that have more than one line of reportage. For instance, a company might contain an engineering department with engineering managers who workers report to. However, these workers might also have to liaise with a different product or project managers depending on current tasks. Some form of matrix organization is found in most large-scale modern businesses. It is one of the most complicated reporting structures. You can easily build a clear matrix organizational chart in ConceptDraw DIAGRAM using templates from ConceptDraw Solution Park.