How To Create Onion Diagram
An onion diagram is a kind of chart that shows the dependencies among parts of an organization or process. The chart displays items in concentric circles, where the items in each ring depend on the items in the smaller rings. The Onion Diagram is able to show layers of a complete system in a few circles. But how to create Onion Diagram? Now, it's very easy thanks to the ConceptDraw PRO diagramming and vector drawing software extended with Stakeholder Onion Diagrams Solution from the Management Area of ConceptDraw Solution Park.HelpDesk
How to Create a Fault Tree Analysis Diagram (FTD) in ConceptDraw PRO
Fault Tree Diagram are logic diagram that shows the state of an entire system in a relationship of the conditions of its elements. Fault Tree Diagram are used to analyze the probability of functional system failures and safety accidents. ConceptDraw PRO allows you to create professional Fault Tree Diagrams using the basic FTD symbols. An FTD visualize a model of the processes within a system that can lead to the unlikely event. A fault tree diagrams are created using standard logic symbols . The basic elements in a fault tree diagram are gates and events.HelpDesk
How to Create a New Library
Sometimes, when creating a diagram, you need to use a large set of elements from different libraries. If you are using ConceptDraw , in such case, we recommend you to create a new library, which consists of vector library objects from other ConceptDraw libraries. You also can add some custom unique objects into such library. Each object that contains in a new library can be provided with a unique description and keyword list. Thus, the new library and its objects will be indexed to be searched and used in the further diagrams.HelpDesk
How to Draw a Pie Chart Using ConceptDraw PRO
A pie chart represents data, in a clear and easy to read round (pie) form. A circular pie chart is divided into sections (slice). Each "slice" depicts the It reflects the proportion of each component in the whole "pie". This type of chart is most often used for the visualization of statistical data. That is why pie charts are widely used in marketing. As pie charts show proportional proportional parts of a whole, they are good for various visual comparisons. For example, it is difficult to imagine a more intuitive way to show segmentation and market share. ConceptDraw PRO allows you to draw a simple and clear Pie Chart using the Pie Charts solution.HelpDesk
How to Create a Network Security Diagram Using ConceptDraw PRO
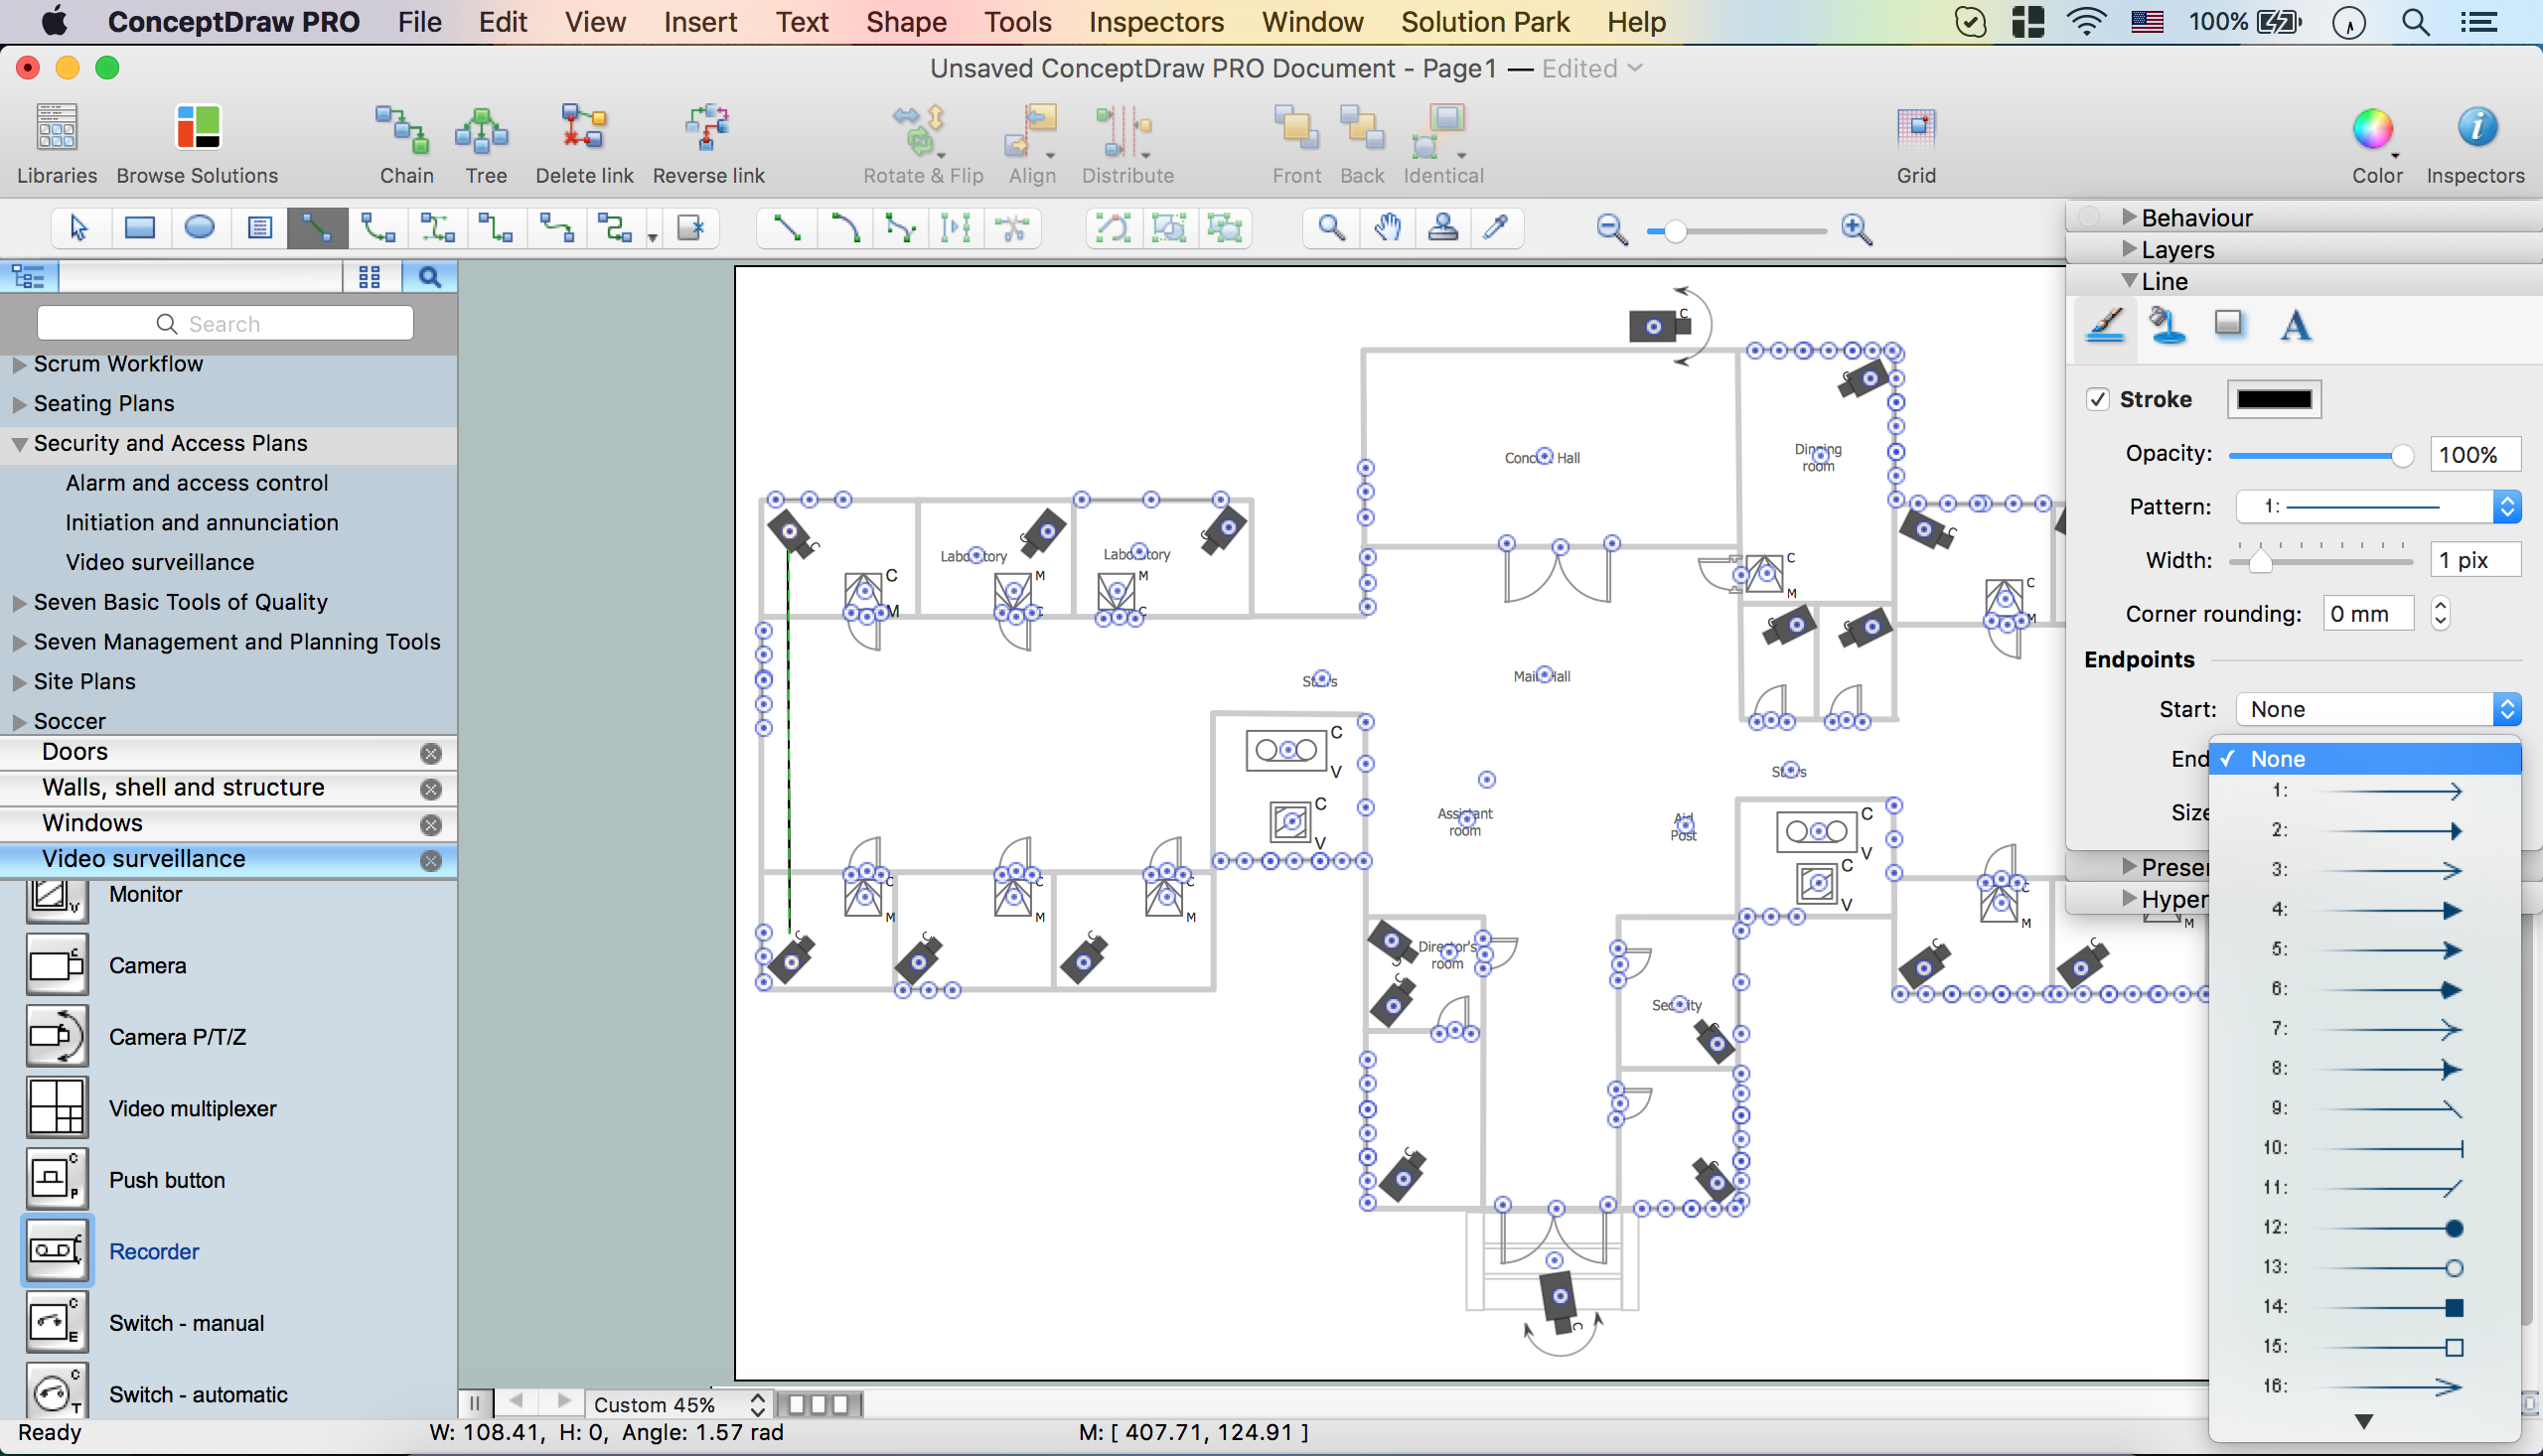
Network security requires constant work and attention to details. Each user, whether an individual or organization, owns an information, considered to be valuable. The enforcement of network security, whether it be a local network security, or wireless network security is core for creating the secure environment of the daily working processes. Network security is accomplished through hardware and software. Network security system must be sophisticated and modern inside, but simple and understandable for the user. The visual scheme of security system can be presented in the form of a Network Security diagram. ConceptDraw PRO provides the toolkit for network security system visualization with its Network Security Diagram solution.How To Create CCTV Network Diagram
Closed-circuit television (CCTV) uses cameras and monitors to carry out video surveillance. Unlike broadcast television this system has only local signal. It is a feature of almost every video camera, yet CCTV is mainly a system for visual control of certain areas such as banks, airports, supermarkets, and other places for security reasons. Developing and installing CCTV system is a time-consuming process. It also requires certain knowledge and skills. ConceptDraw is a solution of setting video cameras rationally. You can achieve two aims at once: CCTV Design Tool saves your time and your money and helps you make professional video surveillance system.Network Diagram Software Logical Network Diagram
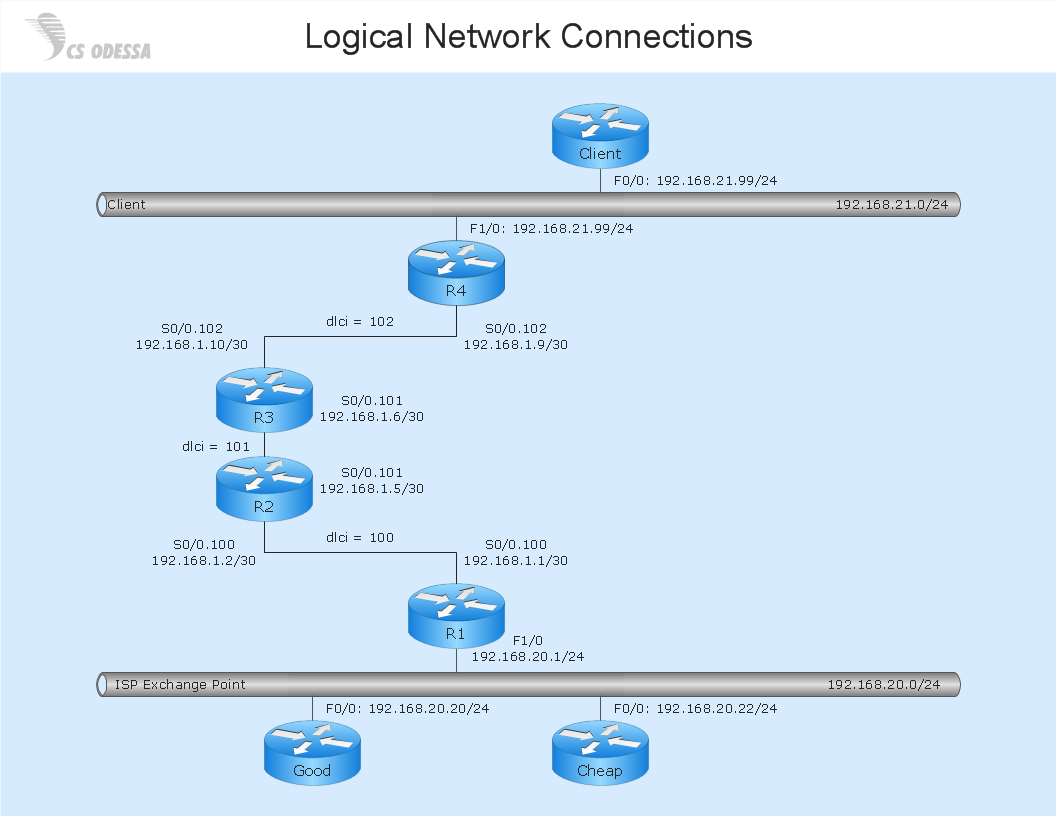
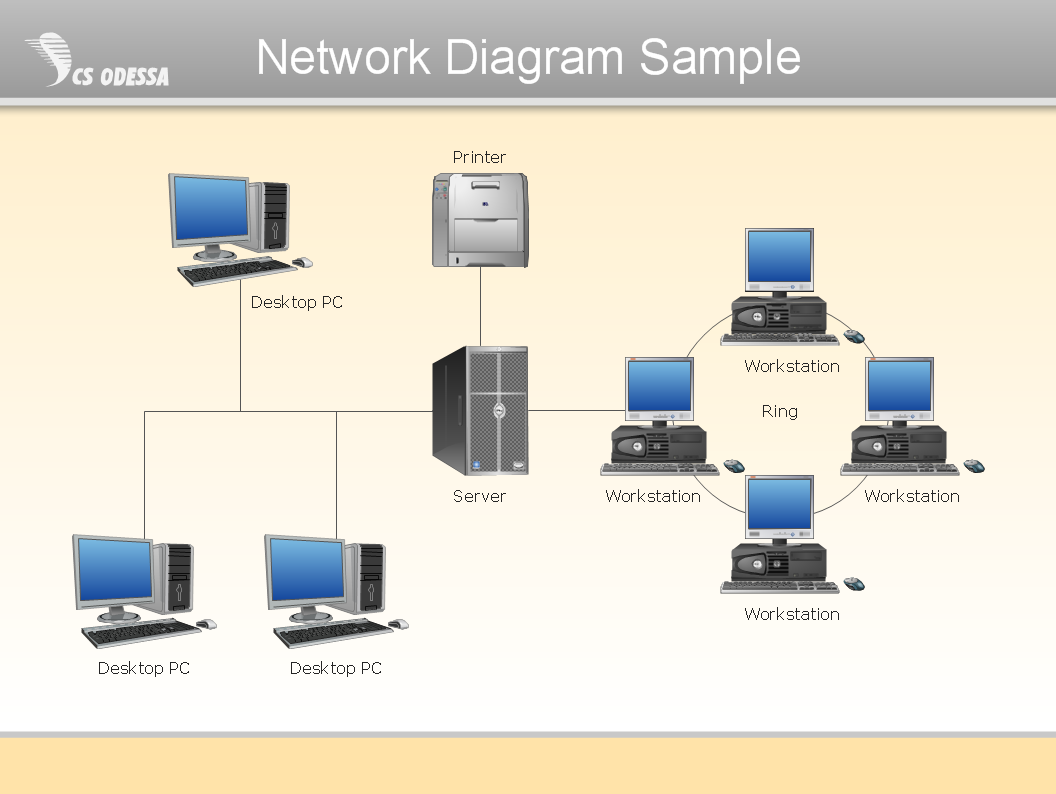
Perfect Network Diagramming Software with examples of LAN Diagrams. ConceptDraw Network Diagram is ideal for network engineers and network designers who need to draw Logical Network diagrams.
Process Flowchart
The main reason of using Process Flowchart or PFD is to show relations between major parts of the system. Process Flowcharts are used in process engineering and chemical industry where there is a requirement of depicting relationships between major components only and not include minor parts. Process Flowcharts for single unit or multiple units differ in their structure and implementation. ConceptDraw PRO is Professional business process mapping software for making Process flowcharts, Process flow diagram, Workflow diagram, flowcharts and technical illustrations for business documents and also comprehensive visio for mac application. Easier define and document basic work and data flows, financial, production and quality management processes to increase efficiency of your business with ConcepDraw PRO. Business process mapping software with Flowchart Maker ConceptDraw PRO includes extensive drawing tools, rich examples and templates, process flowchart symbols and shape libraries, smart connectors that allow you create the flowcharts of complex processes, process flow diagrams, procedures and information exchange. Process Flowchart Solution is project management workflow tools which is part ConceptDraw Project marketing project management software. Drawing charts, diagrams, and network layouts has long been the monopoly of Microsoft Visio, making Mac users to struggle when needing such visio alternative like visio for mac, it requires only to view features, make a minor edit to, or print a diagram or chart. Thankfully to MS Visio alternative like ConceptDraw PRO software, this is cross-platform charting and business process management tool, now visio alternative for making sort of visio diagram is not a problem anymore however many people still name it business process visio tools.
HelpDesk
How to Create a Timeline Diagram in ConceptDraw PRO
A Timeline is a chart which displays a project plan schedule in chronological order. A Timeline is used in project management to depict project milestones and visualize project phases, and show project progress. The graphic form of a timeline makes it easy to understand critical project milestones, such as the progress of a project schedule. Timelines are particularly useful for project scheduling or project management when accompanied with a Gantt chart. It captures the main of what the project will accomplish and how it will be done. making a project timeline is one of the most important skills a project manager needs have. Making comprehensive, accurate timelines allows you getting every project off in the best way. ConceptDraw PRO allows you to draw a timeline charts using special library.HelpDesk
How To Create an Affinity Diagram Using ConceptDraw Office
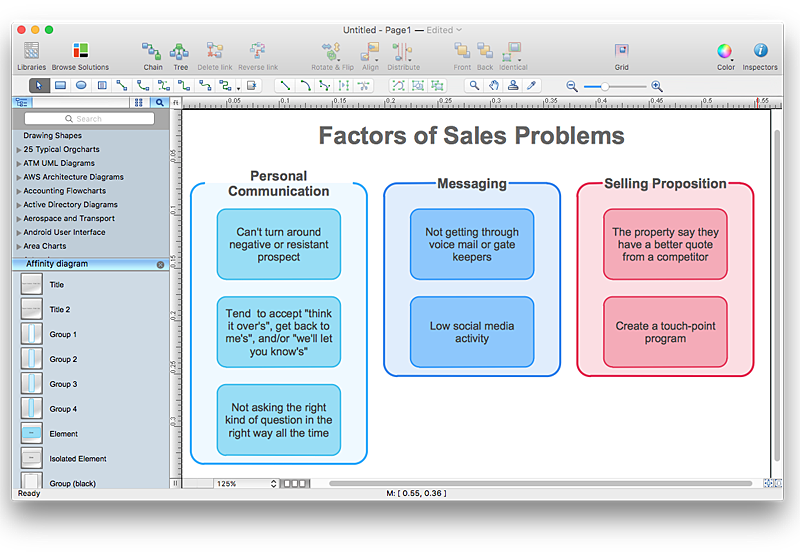
Affinity diagram is designed to prepare the data for further analysis of the cause-effect relationships.The Affinity diagram shows the structure of large, complex factors that have an influence on a problem, and then divides them up into a smaller and simpler structure. We recommend using a mind map for Brainstorming and collecting the factors affecting the problem. The ability to create an Affinity diagram from a mind map is supported by the ConceptDraw Seven Management and Planning Tools solution.HelpDesk
How to Create the Custom Diagram Template on Mac
ConceptDraw?PRO enables you to?place your own templates. You can create diagram with ConceptDraw PRO using your custom Template. You can set up your Template as a default ConceptDraw PRO start page. A template diagram is a drawing that serves as a starting point for a new graphic document. When you open a template, it is pre-formatted in some way. For example, you might use template that is formatted as an organizational chart. The template would likely have a workspace and a corresponding object libraries. When you save a file created with a template, you are usually prompted to save a copy of the file, so that you don't save over the template. Templates can either come with a proper solution or can be created by the user. If you find yourself creating similar documents over and over again, it might be a good idea to save one of them as a template. Then you won't have to format your documents each time you want to make a new one. Just open the template and start from there.HelpDesk
How to Create a Fishbone (Ishikawa) Diagram Quickly
A Fishbone (Ishikawa) diagram is also called cause-and-effect diagram. Fishbone diagram is often used in business to determine the cause of some problem. The diagram illustrates the main causes and sub-causes leading to an event. The main goal of the Fishbone diagram is to illustrate in a graphical way the relationship between a given outcome and all the factors that influence this outcome. The complete diagram resembles a fish skeleton as its name implies. The ability to create a Fishbone Diagram is supported by the Fishbone Diagram solution. Use ConceptDraw MINDMAP for structuring data and then ConceptDraw PRO for generating a Fishbone Diagram from mind map structure.Network Diagram Software Physical Network Diagram
ConceptDraw Network Diagram Software is ideal for network engineers and network designers who need to draw Physical Network Diagrams.
How to Create Presentation of Your Project Gantt Chart
During the planning, discussing and execution of a project you may need to prepare a presentation using project views such as the Gantt Chart, Multiproject Dashboard or Resource Usage View. It’s easy do with ConceptDraw PROJECT!HelpDesk
How to Create Flowchart Using Standard Flowchart Symbols
Flowcharts are used to display an algorithm for consistent execution of certain steps. Flowchart is probably the easiest way to make a graphical representation of any process. Flowcharts use the set of standard geometric symbols and arrows to define relationships. ConceptDraw PRO allows you to create professional flowchart quickly and easily. The ability to create flowcharts is contained in the Flowcharts solution. The solution provides a set of special tools for creating flowcharts.- Emergency Plan | Fire and Emergency Plans | How To Create ...
- How To Create Restaurant Floor Plan in Minutes | Restaurant Floor ...
- How to Create a HR Process Flowchart Using ConceptDraw PRO ...
- Plumbing and Piping Plans | How to Create a Residential Plumbing ...
- Reflected Ceiling Plans | How to Create a Reflected Ceiling Floor ...
- How To Create CCTV Network Diagram
- Process Flowchart | Basic Flowchart Symbols and Meaning | How to ...
- Diagramming tool - Amazon Web Services and Cloud Computing ...
- Create Graphs and Charts | Bar Diagrams for Problem Solving ...
- Telecommunication Network Diagrams | How To Create a MS Visio ...
- How To Create Restaurant Floor Plan in Minutes | Restaurant ...
- How to Create an IDEF0 Diagram for an Application Development ...
- Network Layout Floor Plans | Design elements - Network layout ...
- How To Create a MS Visio Cause and Effect Diagram Using ...
- Create Factory Floor Plan
- Create A School Floor Plan
- HVAC Plans | How to Create a HVAC Plan | HVAC Business Plan ...
- Data Flow Diagrams | Data Flow Diagram | How to Create a Data ...
- Directional Maps | How to Create a Directional Map Using ...
- How to Create a CCTV Diagram in ConceptDraw PRO | How To ...


