How To Create Onion Diagram

Organizational Structure Diagram Software


Onion Diagram Process Design

Stakeholder Onion Diagrams

Onion Diagram Templates

"A target market is a group of customers that the business has decided to aim its marketing efforts and ultimately its merchandise towards. A well-defined target market is the first element to a marketing strategy. The marketing mix variables of product, place (distribution), promotion and price are the four elements of a marketing mix strategy that determine the success of a product in the marketplace." [Target market. Wikipedia]
"An onion diagram is a kind of chart that shows the dependencies among parts of an organization or process. The chart displays items in concentric circles, where the items in each ring depend on the items in the smaller rings. ...
The Onion Diagram is able to show layers of a complete system in a few circles. Each of the circles is able to represent a component that is dependent upon the component on the inside of it shown by the circle inside of it. The main concept of the diagram is shown by the center circle of the diagram. This chart is used due to the fact that it has a clear visual representation that is easy to read, and it has a strong visual impact." [Onion diagram. Wikipedia]
This onion diagram (target diagram) example "Target market" was created using the ConceptDraw PRO diagramming and vector drawing software extended with the Target and Circular Diagrams solution from the Marketing area of ConceptDraw Solution Park.
www.conceptdraw.com/ solution-park/ marketing-target-and-circular-diagrams
Onion diagram

Onion Diagram Maker

TQM Software — Build Professional TQM Diagrams

Stakeholder Mapping Tool

Visualize Stakeholder Analysis

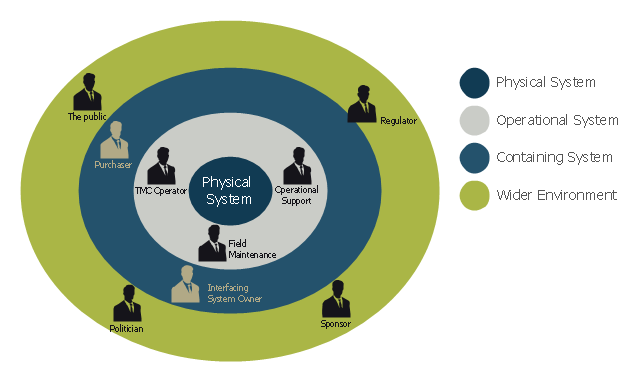
This onion diagram example was designed on the base of figure "Stakeholders for a System" in the slide presentation "A103: Introduction to ITS Standards Requirements Development" from the U.S. Department of Transportation (US DOT) website.
"“Stakeholders for a System.” A graphic of four concentric circles arranged like an archery target. The innermost circle is a reddish tan. The three bands of colors that are further from the center are in lighter shades of tan. This is called an “onion diagram” as onions are made up of multiple layers. The inner circle is labeled “Physical System.” The next layer outward is labeled “Operational System.” The next layer outward is labeled “Containing System.” The outermost layer is labeled “Wider Environment.” There are smaller black graphics of person positioned in the different layers of the diagram. Each person has a project role next to it as follows: 1) Inner Circle has no people – It represents the system; 2) Next Layer Outward has three people labeled TMC Operator, Field Maintenance, and Operational Support respectively; 3) Next Layer Outward has two people labeled Interfacing System Owner and Purchaser respectively; and 4) Outermost Layer has four people labeled Sponsor of the Project, Regulatory Agency, Public, and Politician respectively. The picture demonstrates while they are all stakeholders, different stakeholders have different levels of influence on the physical system to be defined. The most influence coming from those closest to the center."
[pcb.its.dot.gov/ standardstraining/ mod04/ ppt/ m04ppt.htm]
The onion diagram example "System stakeholders diagram" was drawn using the ConceptDraw PRO software extended with the Stakeholder Onion Diagrams solution from the Management area of ConceptDraw Solution Park.
Onion diagram example
 Stakeholder Onion Diagrams
The Stakeholder Onion Diagram is often used as a way to view the relationships of stakeholders to a project goal. A basic Onion Diagram contains a rich information. It shows significance of stakeholders that will have has influence to the success achieve
Cross Functional Flowchart

Stakeholder Onion Diagram Template

Virtual private networks (VPN). Computer and Network Examples
. Computer and Network Examples")

- Icon Png Analysis Stakeholder
- Stakeholder Vector Png
- Graphic Design Circles Png
- Green Double Circle In Png
- Sample Circle Calendar Png
- Stakeholder Management Icon Png
- Stakeholder Png Icon
- Png Stakeholder
- Png Round Circle
- Stakeholder Analysis Png
- Powerpoint Ring Png
- Labour Icon Png Large
- Document Icon Circle Png
- Vector Circle Design Png
- Contribution Icon Png
- Document Icon Png Circle
- 4 Arrow Wheel Png
- Vector Calendario Circular Png
- Stakeholder Png
- Stakeholders Relationship Png