 Stakeholder Onion Diagrams
The Stakeholder Onion Diagram is often used as a way to view the relationships of stakeholders to a project goal. A basic Onion Diagram contains a rich information. It shows significance of stakeholders that will have has influence to the success achieve
HelpDesk
How to Create a Stakeholder Onion Diagram

Stakeholder Mapping Tool

Gane Sarson Diagram

Stakeholder Management System

Visualize Stakeholder Analysis

Stakeholder Onion Diagrams

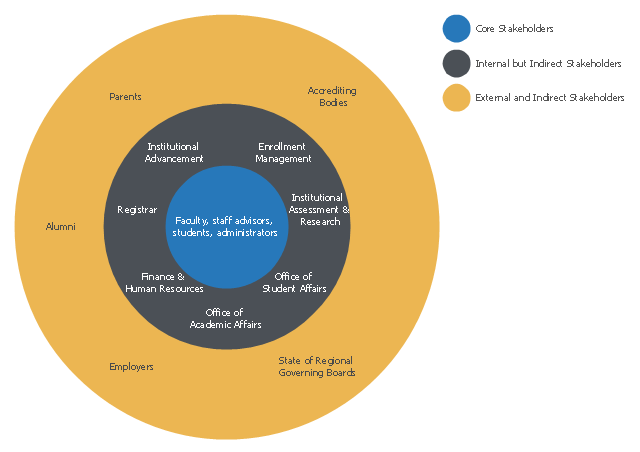
This onion diagram example was designed on the base of figure "Academic advising stakeholder framework" in the article "Defining Advising Stakeholder Groups" by Julianne Messia from the website of NACADA Executive Office,
Kansas State University.
"A complete stakeholder analysis, therefore, not only names the stakeholders but accurately characterizes each stakeholder’s power and influence.
Harney (2008) identified advising stakeholders as being either internal or external constituents. Stakeholders belong in one of three distinct classifications: (1) internal core stakeholders, (2) internal but indirect stakeholders, and (3) external and indirect stakeholders. The chart below (Figure 1) depicts these groups in a diagram representing their various levels of input, influence, and involvement; the closer a group is to the “core” the more investment and weight that group has in advising. The groups utilized in this specific example assume a shared model of advising (both faculty and advising professionals have advising responsibilities). As each institution has its own unique culture and advising model, the chart should be adapted for any program or institution. For instance, an institution with a centralized advising model may list faculty as Internal but Indirect Stakeholders as they do not provide or administer advising directly."
[nacada.ksu.edu/ Resources/ Clearinghouse/ View-Articles/ Defining-Advising-Stakeholder-Groups.aspx]
The onion diagram example "Stakeholder diagram" was drawn using the ConceptDraw PRO software extended with the Stakeholder Onion Diagrams solution from the Management area of ConceptDraw Solution Park.
Onion diagram example
Stakeholder Onion Diagram Template

How To Create Onion Diagram

Onion Diagram Templates

The vector stencils library "Stakeholder icons" contains 41 icons for drawing onion diagrams.
Use it with ConceptDraw PRO software to design your stakeholder diagrams.
"A stakeholder or stakeholders, as defined in its first usage in a 1963 internal memorandum at the Stanford Research Institute, are "those groups without whose support the organization would cease to exist." The theory was later developed and championed by R. Edward Freeman in the 1980s. Since then it has gained wide acceptance in business practice and in theorizing relating to strategic management, corporate governance, business purpose and corporate social responsibility (CSR). A corporate stakeholder can affect or be affected by the actions of a business as a whole.
The term has been broadened to include anyone who has an interest in a matter." [Stakeholder (corporate). Wikipedia]
The icon set example "Design elements - Stakeholder icons" is included in the Stakeholder Onion Diagrams solution from the Management area of ConceptDraw Solution Park.
Icon set for onion diagrams
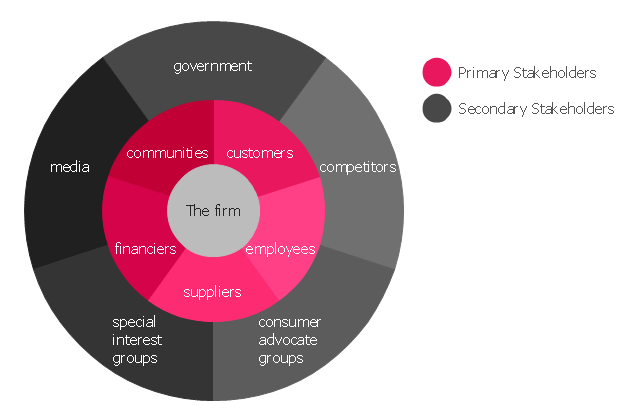
This onion diagram example was designed on the base of figure "Stakeholder Theory Diagram – Firm Centric. Based on R. Edward Freeman" in the article "Stakeholder Theory Diagram … like a donut" from the website "The Society Pages". [thesocietypages.org/ graphicsociology/ 2015/ 02/ 12/ stakeholder-theory-diagram/ ]
"The stakeholder theory is a theory of organizational management and business ethics that addresses morals and values in managing an organization. It was originally detailed by R. Edward Freeman in the book Strategic Management: A Stakeholder Approach identifies and models the groups which are stakeholders of a corporation, and both describes and recommends methods by which management can give due regard to the interests of those groups." [Stakeholder theory. Wikipedia]
This file is licensed under the Creative Commons Attribution Non-Commercial Share Alike license. [creativecommons.org/ licenses/ by-nc-sa/ 3.0/ us/ ]
The onion diagram example "Firm centric stakeholder diagram" was drawn using the ConceptDraw PRO software extended with the Stakeholder Onion Diagrams solution from the Management area of ConceptDraw Solution Park.
Onion diagram
- Stakeholder Onion Diagrams | Basketball Plays Software | Network ...
- Economic sector weightings | Divided Bar Diagrams | Stakeholder ...
- Sector weightings - Exploded pie chart | Stakeholder Onion ...
- Business Clipart Png
- Business People Vector Png
- People Clipart Png
- Swot Icon Png
- Stakeholder Onion Diagrams | Ring Network Topology | How to ...
- Stakeholder Management System | Quality Management System ...
- Pink Circle Png
- Research cycle - Circle diagram | Target and Circular Diagrams ...
- Png Standard Classroom Plan
- Target and Circular Diagrams | Research cycle - Circle diagram ...
- ER Diagram Styles | Entity Relationship Diagram Symbols | Chen ...
- Last resort hotel book room process - DFD | How To use House ...
- Research cycle - Circle diagram | Innovation life cycle - Arrow loop ...
- Marketing mix - Wheel diagram
- Economic sector weightings | Bar Diagrams for Problem Solving ...
- Carrot Vector Png
- Process Flowchart | Structured Systems Analysis and Design ...