 ConceptDraw Solution Park
ConceptDraw Solution Park collects graphic extensions, examples and learning materials
Process Flowchart
The main reason of using Process Flowchart or PFD is to show relations between major parts of the system. Process Flowcharts are used in process engineering and chemical industry where there is a requirement of depicting relationships between major components only and not include minor parts. Process Flowcharts for single unit or multiple units differ in their structure and implementation. ConceptDraw PRO is Professional business process mapping software for making Process flowcharts, Process flow diagram, Workflow diagram, flowcharts and technical illustrations for business documents and also comprehensive visio for mac application. Easier define and document basic work and data flows, financial, production and quality management processes to increase efficiency of your business with ConcepDraw PRO. Business process mapping software with Flowchart Maker ConceptDraw PRO includes extensive drawing tools, rich examples and templates, process flowchart symbols and shape libraries, smart connectors that allow you create the flowcharts of complex processes, process flow diagrams, procedures and information exchange. Process Flowchart Solution is project management workflow tools which is part ConceptDraw Project marketing project management software. Drawing charts, diagrams, and network layouts has long been the monopoly of Microsoft Visio, making Mac users to struggle when needing such visio alternative like visio for mac, it requires only to view features, make a minor edit to, or print a diagram or chart. Thankfully to MS Visio alternative like ConceptDraw PRO software, this is cross-platform charting and business process management tool, now visio alternative for making sort of visio diagram is not a problem anymore however many people still name it business process visio tools.
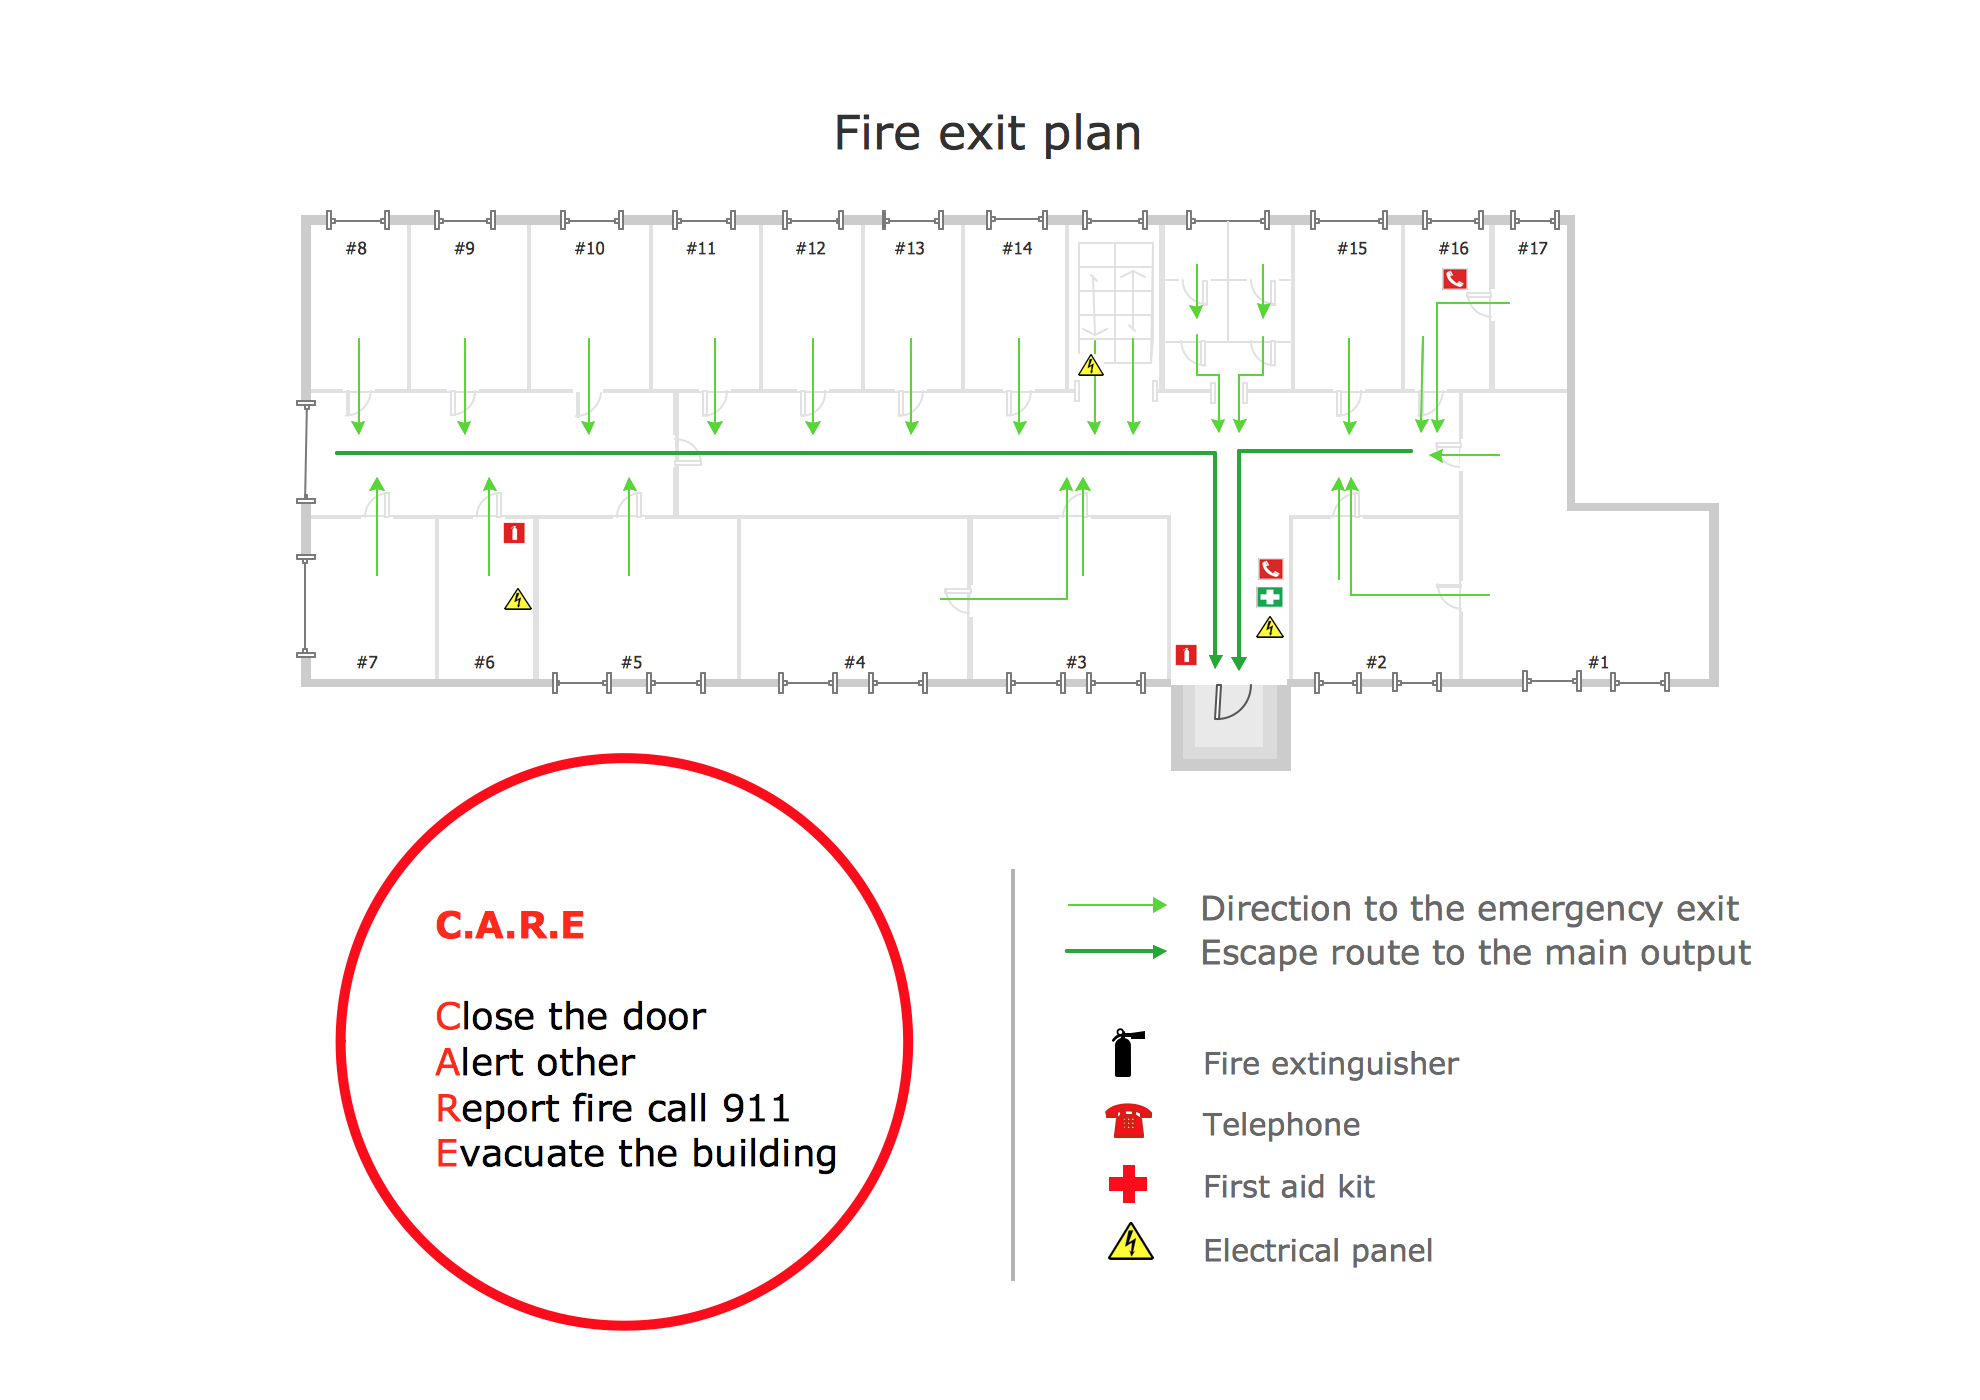
Fire Exit Plan. Building Plan Examples
Fire exit plan or Emergency exit plan is an obligatory scheme for schools, universities, hospitals, hotels, business centers, metro, airports, and a lot of other buildings, public and private institutions. Fire exit plan depicts detailed plan of the building with marked emergency exits on it and helps to implement faster evacuation in various emergencies such as a fire. If a regular exit is blocked by fire, the plan helps to find the alternative exits, on the route to which are placed the signs leading to it. Fire and Emergency Plans solution from the Building Plans area of ConceptDraw Solution Park provides examples and samples, Fire and Emergency Plan quick-start template and vector stencils library with fire-fighting equipment design elements for drawing different types of emergency and fire schemes and plans: Evacuation plans, Fire Exit plans, Home Emergency plans, School Emergency plans, Office Emergency plans, Fire Emergency plans, Fire Evacuation plans, Fire Safety diagrams, Business Emergency plans, etc.HelpDesk
How to Create a Timeline Diagram in ConceptDraw PRO
A Timeline is a chart which displays a project plan schedule in chronological order. A Timeline is used in project management to depict project milestones and visualize project phases, and show project progress. The graphic form of a timeline makes it easy to understand critical project milestones, such as the progress of a project schedule. Timelines are particularly useful for project scheduling or project management when accompanied with a Gantt chart. It captures the main of what the project will accomplish and how it will be done. making a project timeline is one of the most important skills a project manager needs have. Making comprehensive, accurate timelines allows you getting every project off in the best way. ConceptDraw PRO allows you to draw a timeline charts using special library.
 Value Stream Mapping
Value stream mapping solution extends ConceptDraw PRO software with templates, samples and vector stencils for drawing the Value Stream Maps (VSM) in lean manufacturing practice.
 Event-driven Process Chain Diagrams
Event-driven Process Chain (EPC) Diagram is a type of flowchart widely used for modeling in business engineering and reengineering, business process improvement, and analysis. EPC method was developed within the Architecture of Integrated Information Systems (ARIS) framework.
 Seven Basic Tools of Quality
Manage quality control in the workplace, using fishbone diagrams, flowcharts, Pareto charts and histograms, provided by the Seven Basic Tools of Quality solution.
Technical Drawing Software
In conditions of rapidly developing and progressing modern technologies in various fields of science and technics, a powerful specialized software is very popular and highly demanded today. In this area particularly valuable is a technical drawing software. ConceptDraw PRO is a unique professional vector diagramming software for business and technical drawing. Enhanced with powerful drawing tools of Mechanical Engineering solution from the Engineering area of ConceptDraw Solution Park, it is ideal for designing Technical Drawings, Electrical Schematics, Mechanical Systems Drawings, Plumbing Drawings, Structural Drawings, Architectural Drawings, Circuit Diagrams, and many other types of technical diagrams and schematics of any degree of complexity and any level of detailing. Included numerous predesigned mechanical engineering and technical drawing objects and symbols make a technical drawing process as simple as possible. Besides, ConceptDraw PRO offers extensive export capabilities that promote the active exchange of ideas and results with colleagues and other stakeholders.
 Mechanical Engineering
This solution extends ConceptDraw PRO v.9 mechanical drawing software (or later) with samples of mechanical drawing symbols, templates and libraries of design elements, for help when drafting mechanical engineering drawings, or parts, assembly, pneumatic,
Examples of Flowcharts, Org Charts and More
ConceptDraw PRO covers a broad spectrum of business graphics categories and offers at ConceptDraw STORE enormous online collection of pictorial examples and samples for different thematics and application areas. It is a plentiful source of inspiration and wonderful examples of professionally designed diagrams, flowcharts, UML diagrams, organizational charts, databases, ERDs, network diagrams, business charts, different thematic charts, schematics, infographics and plans developed specially for knowledge workers, engineers, managers, businessmen, marketing specialists, analytics, scientists, students, professors, journalists and also for a large number of other people that every day use various diagrams and drawings in their work and life activity. Each of these examples is a real art, all they are well thought-out and designed without efforts with help of powerful tools of ConceptDraw PRO software. ConceptDraw examples display all variety of tasks, possibilities and results that ConceptDraw Product Line lets achieve fast and easy. ConceptDraw is one of the best Visio alternatives for Mac. It open all Visio formats like .vsdx, .vss, .vdx files and allows you to export files to Visio formats.
 Business Processes Area
Solutions of Business Processes area extend ConceptDraw PRO software with samples, templates and vector stencils libraries for drawing business process diagrams and flowcharts for business process management.
 Fishbone Diagrams
The Fishbone Diagrams solution extends ConceptDraw PRO v10 software with the ability to easily draw the Fishbone Diagrams (Ishikawa Diagrams) to clearly see the cause and effect analysis and also problem solving. The vector graphic diagrams produced using this solution can be used in whitepapers, presentations, datasheets, posters, and published technical material.
HelpDesk
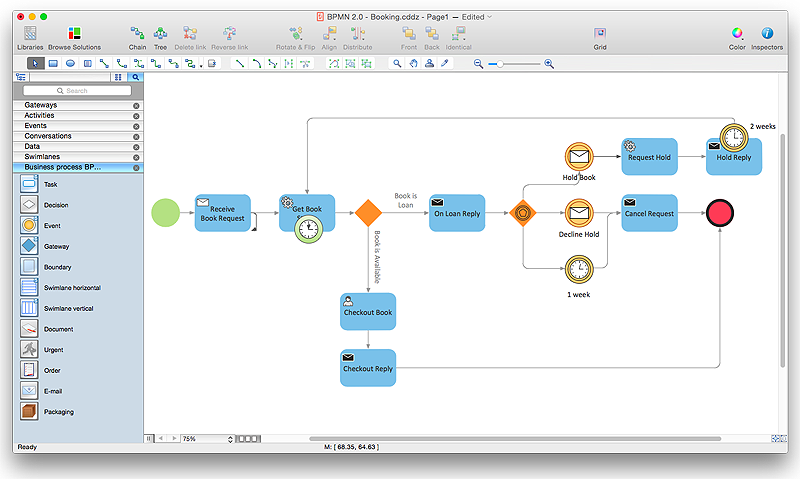
How to Create a BPMN Diagram Using ConceptDraw PRO
Business Process Modeling Notation (BPMN) is a method of illustrating business processes in the form of a diagram. The most effective method of creating or analyzing a business process is to visually interpret the steps using a business process diagram, flowchart or workflow. This is known as business process modeling, and will be performed within a company by a team who have detailed knowledge of company process, and analysts with expertise in the modeling discipline. The objective is often to increase production or lower costs — by modeling the process initially using a flowchart, inefficiencies and problems can be spotted before committing to a decision or strategy. You can create BPMN diagrams using the ConceptDraw PRO diagramming tools. ConceptDraw have designed a solution that combines BPMN v2.0 methodology and graphical notification into one powerful package. The Business Process Diagrams solution from ConceptDraw Solution Park provides a comprehensive collection of vector- Plant Layout Plans | Factory layout floor plan | How To Draw ...
- Design elements - Machines and equipment | Hotel Plan . Hotel Plan ...
- Factory layout floor plan | Building Drawing Software for Design ...
- Factory layout floor plan | Piping and Instrumentation Diagram ...
- Plant Layout Plans | Factory layout floor plan | Plant Design | Plant ...
- Factory layout floor plan | Interior Design Machines and Equipment ...
- Building Drawing Software for Design Office Layout Plan | Computer ...
- Hotel Plan . Hotel Plan Examples | Computer and Networks Area ...
- Interior Design Machines and Equipment - Design Elements ...
- Factory layout floor plan | Buildings and green spaces - Vector ...
- Factory layout floor plan | Plant Layout Plans | Piping and ...
- Gym equipment layout floor plan | Classroom furniture and ...
- Interior Design Machines and Equipment - Design Elements ...
- Plant Layout Plans | Cafe and Restaurant Floor Plan | Factory layout ...
- Factory layout floor plan | Plant Layout Plans | ConceptDraw ...
- Plant Layout Plans | Factory layout floor plan | ConceptDraw ...
- Network Layout Floor Plans | Cafe and Restaurant Floor Plan ...
- Factory layout floor plan | Plant Layout Plans | Cafe and Restaurant ...
- How To Draw Building Plans | Plant Layout Plans | Factory layout ...
- Factory layout floor plan | Plant Layout Plans | Warehouse layout ...


