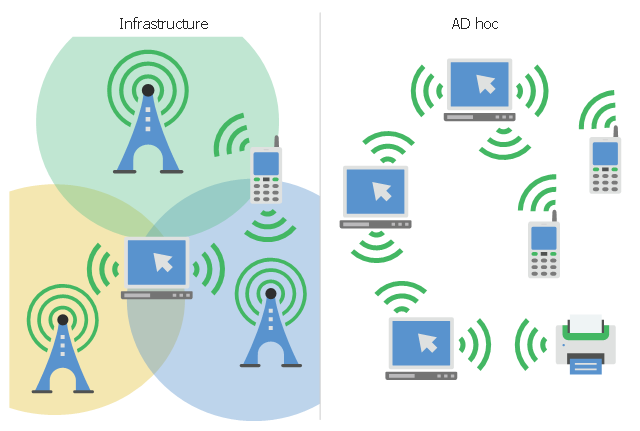
This infographic sample visualizes the Conventional and wireless ad hoc network. It was designed on the base of the Wikimedia Commons file: Běžná bezdrátová síť a ad hoc síť.png.
[commons.wikimedia.org/ wiki/ File:B%C4%9B%C5%BEn%C3%A1_ bezdr%C3%A1tov%C3%A1_ s%C3%AD%C5%A5_ a_ ad_ hoc_ s%C3%AD%C5%A5.png]
This file is licensed under the Creative Commons Attribution-Share Alike 4.0 International license. [creativecommons.org/ licenses/ by-sa/ 4.0/ deed.en]
"A wireless ad hoc network (WANET) is a decentralized type of wireless network. The network is ad hoc because it does not rely on a pre existing infrastructure, such as routers in wired networks or access points in managed (infrastructure) wireless networks. Instead, each node participates in routing by forwarding data for other nodes, so the determination of which nodes forward data is made dynamically on the basis of network connectivity. In addition to the classic routing, ad hoc networks can use flooding for forwarding data.
Wireless mobile ad hoc networks are self-configuring, dynamic networks in which nodes are free to move. Wireless networks lack the complexities of infrastructure setup and administration, enabling devices to create and join networks "on the fly" – anywhere, anytime." [Wireless ad hoc network. Wikipedia]
The infographic example "Conventional and wireless ad hoc network" was created using the ConceptDraw PRO diagramming and vector drawing software extended with the Computers and Communications solution from the Illustration area of ConceptDraw Solution Park.
Network infographic
 Business Process Workflow Diagrams
The Business Process Workflow Diagrams solution enhances the ConceptDraw DIAGRAM functionality with predesigned examples, samples and a numerous collection of predesigned vector objects of workflow chart elements, icons, arrows, connectors, and varied wor
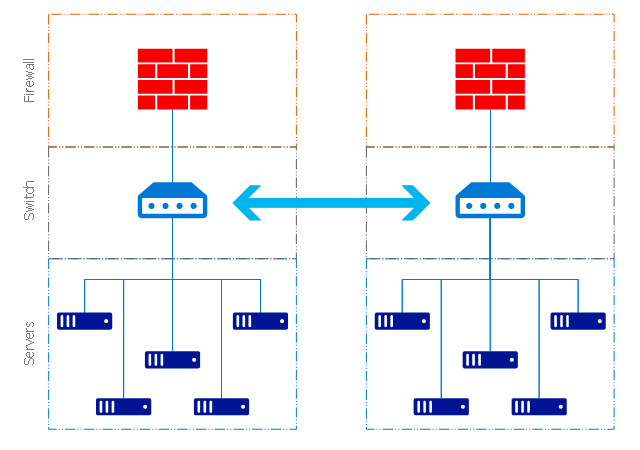
This example of cloud computing system architecture diagram was redesigned from the Wikimedia Commons file: ArchitectureCloudLinksSameSite.png. [commons.wikimedia.org/ wiki/ File:ArchitectureCloudLinksSameSite.png]
"An example showing a grid computing system connecting many personal computers over the Internet using inter-process network communication ...
In computer science, inter-process communication (IPC) is the activity of sharing data across multiple and commonly specialized processes using communication protocols. Typically, applications using IPC are categorized as clients and servers, where the client requests data and the server responds to client requests." [en.wikipedia.org/ wiki/ Inter-process_ communication]
"Grid computing is the collection of computer resources from multiple locations to reach a common goal. The grid can be thought of as a distributed system with non-interactive workloads that involve a large number of files. Grid computing is distinguished from conventional high performance computing systems such as cluster computing in that grid computers have each node set to perform a different task/ application. Grid computers also tend to be more heterogeneous and geographically dispersed (thus not physically coupled) than cluster computers." [Grid computing. Wikipedia]
The diagram example "Grid computing system architecture" was created using ConceptDraw PRO diagramming and vector drawing software extended with the Azure Architecture solution from the Computer and Networks area of ConceptDraw Solution Park.
Grid computing system architecture diagram
Export from ConceptDraw DIAGRAM Document to a Graphic File


 Chemical and Process Engineering
This chemical engineering solution extends ConceptDraw DIAGRAM.9.5 (or later) with process flow diagram symbols, samples, process diagrams templates and libraries of design elements for creating process and instrumentation diagrams, block flow diagrams (BFD
 Value Stream Mapping
Value stream mapping solution extends ConceptDraw DIAGRAM software with templates, samples and vector stencils for drawing the Value Stream Maps (VSM) in lean manufacturing practice.
Diagramming tool - Amazon Web Services and Cloud Computing Diagrams

Diagramming Software for Design UML Communication Diagrams


Communication Diagram UML2.0 / Collaboration UML1.x

 HR Flowcharts
Human resource management diagrams show recruitment models, the hiring process and human resource development of human resources.
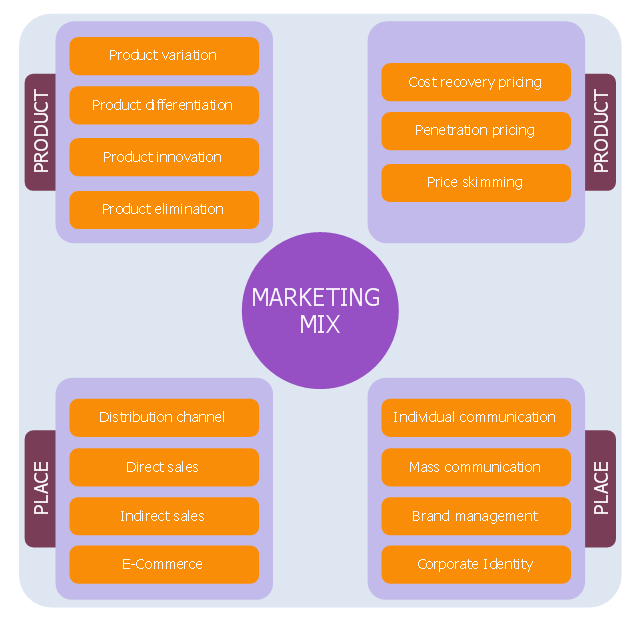
This diagram sample depicts marketing mix. It was designed on the base of the Wikimedia Commons file: Marketing-Mix (en).png.
[commons.wikimedia.org/ wiki/ File:Marketing-Mix_ %28en%29.png]
"The marketing mix is a business tool used in marketing and by marketeers . The marketing mix is often crucial when determining a product or brand's offer, and is often associated with the four P's: price, product, promotion, and place. In service marketing, however, the four Ps are expanded to the seven P's or eight P's to address the different nature of services.
In the 1990s, the concept of four C's was introduced as a more customer-driven replacement of four P's. There are two theories based on four Cs: Lauterborn's four Cs (consumer, cost, communication, convenience), and Shimizu's four Cs (commodity, cost, communication, channel).
In 2012, a new four P's theory was proposed with people, processes, programs, and performance." [Marketing mix. Wikipedia]
The chart example "Marketing mix diagram" was created using the ConceptDraw PRO diagramming and vector drawing software extended with the Marketing Diagrams solution from the Marketing area of ConceptDraw Solution Park.
Chart example
How to Create Network Diagrams

 Event-driven Process Chain Diagrams
Event-Driven Process Chain Diagrams solution extends ConceptDraw DIAGRAM functionality with event driven process chain templates, samples of EPC engineering and modeling the business processes, and a vector shape library for drawing the EPC diagrams and EPC flowcharts of any complexity. It is one of EPC IT solutions that assist the marketing experts, business specialists, engineers, educators and researchers in resources planning and improving the business processes using the EPC flowchart or EPC diagram. Use the EPC solutions tools to construct the chain of events and functions, to illustrate the structure of a business process control flow, to describe people and tasks for execution the business processes, to identify the inefficient businesses processes and measures required to make them efficient.
 Computers and Communications
Computers and communications solution extends ConceptDraw DIAGRAM software with illustration samples, templates and vector stencils libraries with clip art of computers, control devices, communications, technology, Apple machines.
Technical Flow Chart

 Business Process Mapping
The Business Process Mapping solution for ConceptDraw DIAGRAM is for users involved in process mapping and creating SIPOC diagrams.
Flowchart on Bank. Flowchart Examples


Process Flow Diagram

Pyramid Diagram

- Communication Icon Png
- Conventional and wireless ad hoc network | Telecom - Vector ...
- Diagramming Software for Design UML Collaboration Diagrams ...
- | Design elements - Conversations BPMN 2.0 | Conversations ...
- Business Communication Clipart Png
- Process Flowchart | Digital Communications Network. Computer and ...
- Cisco optical - Vector stencils library | Optical Splitter Icon Png
- Research Capabilities Icon Png
- Design elements - Android system icons (notification) | Design ...
- Hydraulic circuits | Firewall between LAN and WAN | Loyalty - Arrow ...
- Server Png
- Process Flowchart | Business Process Modeling Notation | BPMN ...
- Success Png Vectors
- HR symbols - Vector stencils library | Company's organizational ...
- Cloud clipart - Vector stencils library | Business - Design Elements ...
- Social Ecological Model (SEM) - Onion diagram | Sales Call | Hiring ...
- Management Team Icon Png
- Power Plant Png
- Png Hand Shake
- Grid computing system architecture