Examples of Flowcharts, Org Charts and More


HelpDesk
How to Draw a Pie Chart

Types of Welding in Flowchart

IDEF9 Standard

Data modeling with ConceptDraw DIAGRAM

The vector stencils library "Logical network diagram" contains 16 symbols for drawing logical computer network diagrams.
"The logical topology ... is the way that the signals act on the network media, or the way that the data passes through the network from one device to the next without regard to the physical interconnection of the devices. A network's logical topology is not necessarily the same as its physical topology. ...
The logical classification of network topologies generally follows the same classifications as those in the physical classifications of network topologies but describes the path that the data takes between nodes being used as opposed to the actual physical connections between nodes. The logical topologies are generally determined by network protocols as opposed to being determined by the physical layout of cables, wires, and network devices or by the flow of the electrical signals, although in many cases the paths that the electrical signals take between nodes may closely match the logical flow of data, hence the convention of using the terms logical topology and signal topology interchangeably.
Logical topologies are often closely associated with Media Access Control methods and protocols. Logical topologies are able to be dynamically reconfigured by special types of equipment such as routers and switches." [Network topology. Wikipedia]
The symbols example "Logical network diagram - Vector stencils library" was created using the ConceptDraw PRO diagramming and vector drawing software extended with the Computer and Networks solution from the Computer and Networks area of ConceptDraw Solution Park.
www.conceptdraw.com/ solution-park/ computer-and-networks
Server

Disk

Printer
Domain

Network

File

Group

Root

Shared Admin

Directory

Tree

NDS Container

Unknown

Neightborhood

Service

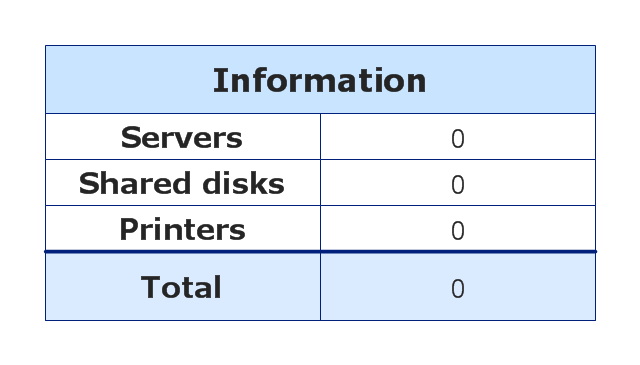
Information
IDEF0 standard with ConceptDraw DIAGRAM

 Computer Network Diagrams
Computer Network Diagrams solution extends ConceptDraw DIAGRAM software with samples, templates and libraries of vector icons and objects of computer network devices and network components to help you create professional-looking Computer Network Diagrams, to plan simple home networks and complex computer network configurations for large buildings, to represent their schemes in a comprehensible graphical view, to document computer networks configurations, to depict the interactions between network's components, the used protocols and topologies, to represent physical and logical network structures, to compare visually different topologies and to depict their combinations, to represent in details the network structure with help of schemes, to study and analyze the network configurations, to communicate effectively to engineers, stakeholders and end-users, to track network working and troubleshoot, if necessary.
Collaboration in a Project Team

Business Models
IDEF4 Standard

- Classification Of Data Flow Diagram
- Classification Of Data Flow Diagram Pdf
- Data Flow Diagram Classification
- Types of Welding in Flowchart | Computer Network Diagrams ...
- Draw A Flowchart Showing Classification Of Resources
- Basic Flowchart Symbols and Meaning | Types of Flowchart ...
- Types of Welding in Flowchart | Computer Network Diagrams ...
- Tree Diagram For Computer Classification
- Classification Of Information System Flow Chart
- Types of Flowcharts | Process Flowchart | Organizational Structure ...
- Computer Network Diagrams | Classification Of Dfd
- Examples of Flowcharts , Org Charts and More | Types of Welding in ...
- 4 Level pyramid model diagram - Information systems types | 5 Level ...
- Examples of Flowcharts , Org Charts and More | Types of Welding in ...
- Draw The Diagram Of All Kind Of Resources Classification
- Make A Flow Chart Showing Classification Of Resources
- Flowchart Marketing Process. Flowchart Examples | Marketing and ...
- Pyramid Diagram | Pyramid Diagram | 4 Level pyramid model ...
- Types of Flowcharts | Types of Flowchart - Overview | Basic ...
- Computer Network Diagrams | How to Draw a Pie Chart Using ...