"Chronic care management encompasses the oversight and education activities conducted by health care professionals to help patients with chronic diseases and health conditions such as diabetes, high blood pressure, lupus, multiple sclerosis and sleep apnea learn to understand their condition and live successfully with it. This term is equivalent to disease management (health) for chronic conditions. The work involves motivating patients to persist in necessary therapies and interventions and helping them to achieve an ongoing, reasonable quality of life." [Chronic care management. Wikipedia]
The health care risk diagram (process decision program chart, PDPC) example "Chronic care improvement" was created using the ConceptDraw PRO diagramming and vector drawing software extended with the solution "Seven Management and Planning Tools" from the Management area of ConceptDraw Solution Park.
The health care risk diagram (process decision program chart, PDPC) example "Chronic care improvement" was created using the ConceptDraw PRO diagramming and vector drawing software extended with the solution "Seven Management and Planning Tools" from the Management area of ConceptDraw Solution Park.
Risk diagram
.png--diagram-flowchart-example.png)
How To Draw a Diagram
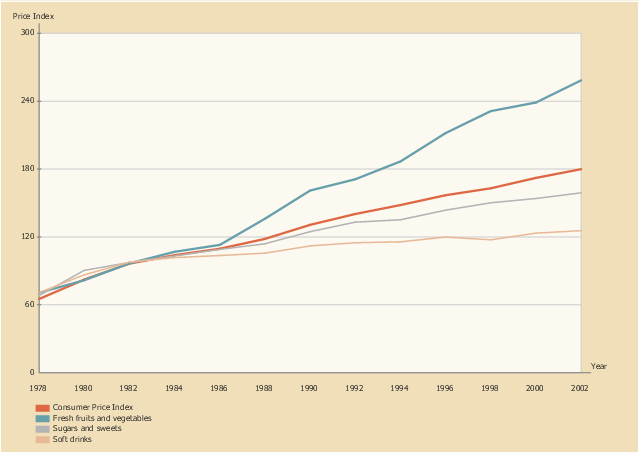
This line graph sample shows the relative price changes for fresh fruits and vegetables, sugars and sweets, and soft drinks, using the period 1982–84 as the baseline (index = 100), 1978–2002. It was designed on the base of line chart from the website of the U.S. National Center for Chronic Disease Prevention and Health Promotion.
"The number of overweight and obese youth has increased in recent decades, yet few data assess how the lives of children have changed during the “obesity epidemic.” ...
Eating as a primary activity declined, suggesting a shift toward snacking or eating as a secondary activity. Statistically significant trends exist for carbohydrate intake, especially for chips/ crackers/ popcorn/ pretzels (intake tripled from the mid-1970s to the mid-1990s) and soft drinks (intake doubled during the same period). Price and income data suggest possible economic reasons for these changes. The percentage of disposable income spent on food has declined continuously, and almost all of the decline has been represented by food consumed at home, yet today’s disposable income buys more calories than it has in the past. Relative prices have encouraged shifts across food types. From a baseline of 100 during 1982–84, the price index for fresh fruit and vegetables increased to 258 by 2002 (far exceeding general inflation), whereas the price index for soft drinks increased only to 126 by 2002 (below general inflation)." [cdc.gov/ pcd/ issues/ 2005/ apr/ 04_ 0039.htm]
The line chart example "Relative price changes for fresh fruits and vegetables, sugars, sweets, soft drinks" was created using the ConceptDraw PRO diagramming and vector drawing software extended with the Line Graphs solution from the Graphs and Charts area of ConceptDraw Solution Park.
Line chart
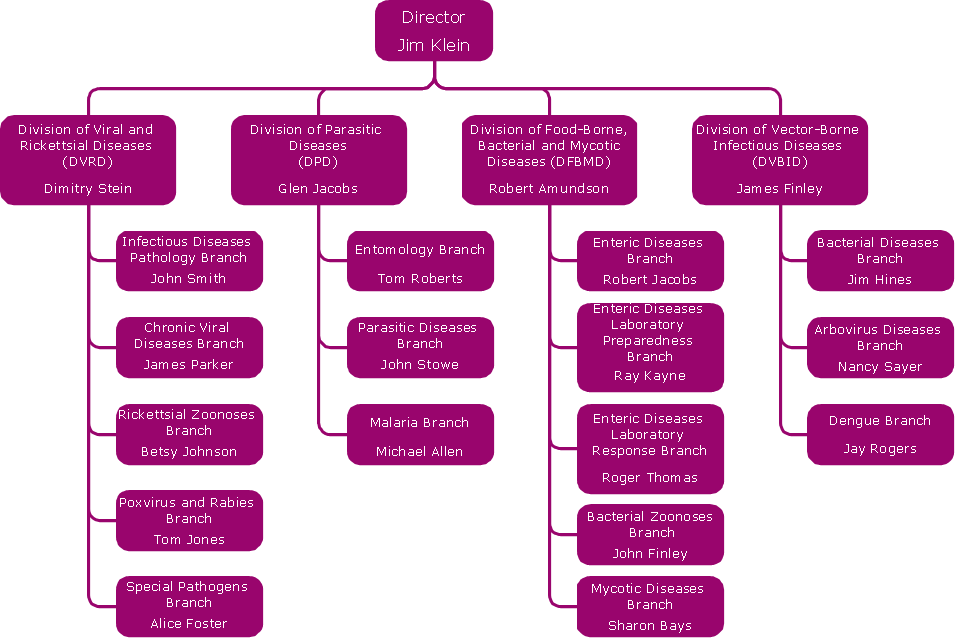
Organogram Software

Create Block Diagram

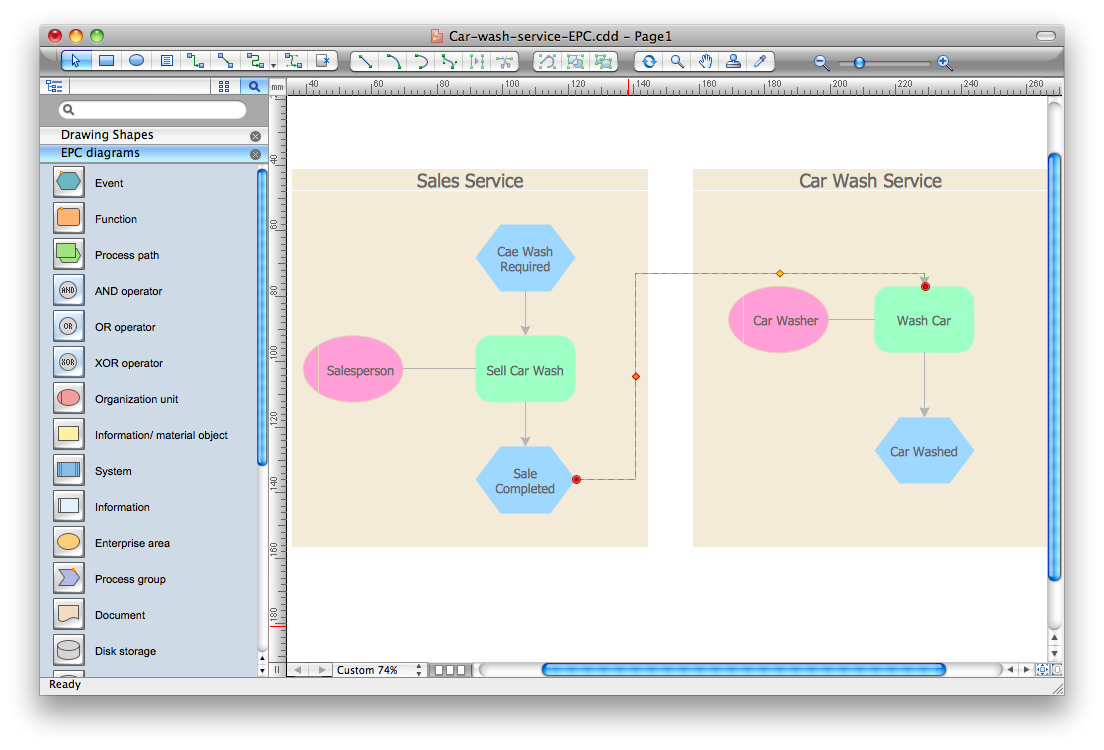
Event-Driven Process Chain Diagram Software
ConceptDraw DIAGRAM - Organizational chart software

How To Make a Bubble Chart

Draw Diagram on Mac
ConceptDraw Arrows10 Technology
Workflow Diagram

Healthy Food Ideas
Create Organizational Chart

Cylinder Venn Diagram

CORRECTIVE ACTIONS PLANNING. Risk Diagram (PDPC)


- Relationships Analysis | Risk diagram - Chronic Illness Management ...
- Risk diagram - Chronic Illness Management Program (CIMP ...
- CORRECTIVE ACTIONS PLANNING. Risk Diagram (PDPC) | Risk ...
- Risk diagram - Chronic Illness Management Program (CIMP ...
- Risk Diagram (Process Decision Program Chart) | Process decision ...
- Physical Activity Plan | Memory Assistant | Professional & Powerful ...
- Social determinants of health | Health Food | CORRECTIVE ...
- Physical Activity Plan | UML Deployment Diagram. Diagramming ...
- Physical Activity Plan | Professional & Powerful Mind Mapping ...
- CORRECTIVE ACTIONS PLANNING. Risk Diagram (PDPC) | How ...
- Drawing Chart On Diseases
- Social determinants of health | Health Food | How to Create ...
- PDPC | Risk diagram (PDPC) - Template | Preventive Action | Pdpc ...
- Gym and Spa Area Plans | Physical Activity Plan | HVAC Business ...
- 5 Level pyramid model diagram - Information systems types | How ...
- Food infogram - Reducing sodium | Banquet Hall Plan Software ...
- Relations diagram - Health care | CORRECTIVE ACTIONS ...
- CORRECTIVE ACTIONS PLANNING. Risk Diagram (PDPC) | How ...
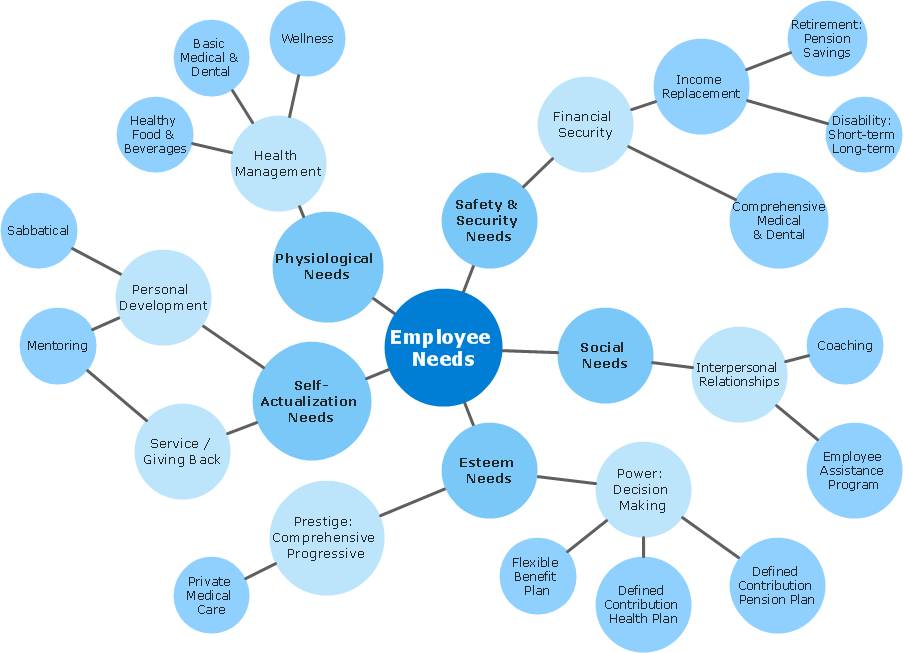
- Advanced persistent threat lifecycle | Employee needs | Roaming ...
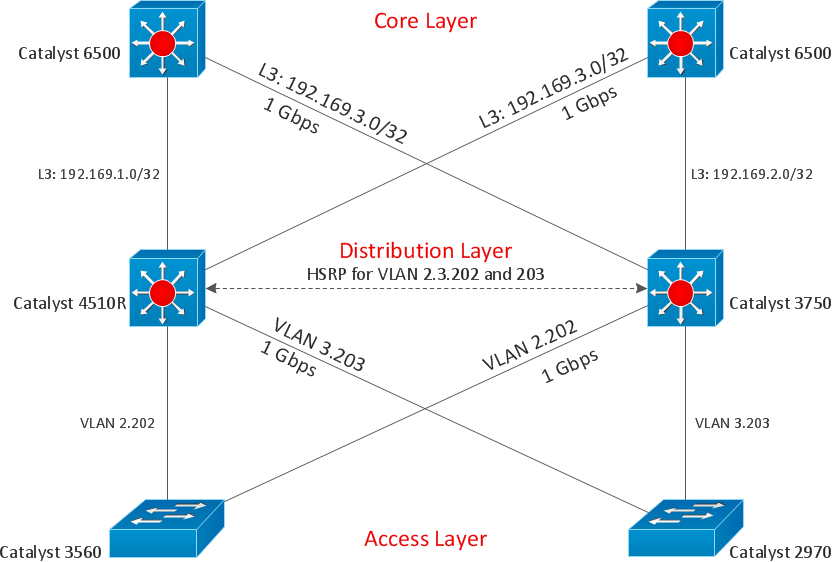
- Network Diagram Software Physical Network Diagram