SWOT Analysis

Simple Drawing Applications for Mac

Competitor Analysis

Bar Diagrams for Problem Solving. Create manufacturing and economics bar charts with Bar Graphs Solution

Venn Diagram Examples for Problem Solving. Environmental Social Science. Human Sustainability Confluence

Bar Diagrams for Problem Solving. Create business management bar charts with Bar Graphs Solution

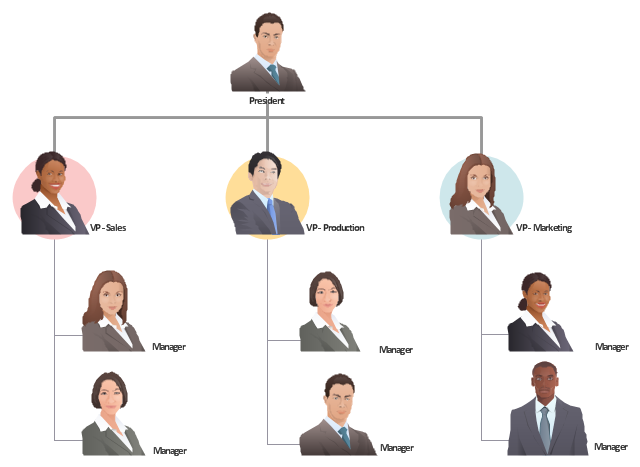
"An organizational structure defines how activities such as task allocation, coordination and supervision are directed towards the achievement of organizational aims. It can also be considered as the viewing glass or perspective through which individuals see their organization and its environment.
Organizations are a variant of clustered entities.
An organization can be structured in many different ways, depending on their objectives. The structure of an organization will determine the modes in which it operates and performs.
Organizational structure allows the expressed allocation of responsibilities for different functions and processes to different entities such as the branch, department, workgroup and individual.
Organizational structure affects organizational action in two big ways. First, it provides the foundation on which standard operating procedures and routines rest. Second, it determines which individuals get to participate in which decision-making processes, and thus to what extent their views shape the organization’s actions." [Organizational structure. Wikipedia]
The example "Company organizational chart" was created using the ConceptDraw PRO diagramming and vector drawing software extended with the People solution from the Illustration area of ConceptDraw Solution Park.
Organizational chart
Types of Flowcharts


Example of Organizational Chart


Matrix Organization Structure

Basic Audit Flowchart. Flowchart Examples

Business Productivity - Marketing

Cause and Effect Diagram

What is SWOT Analysis?

- Business Environment Flow Chart
- Draw A Chart Of Business Environment
- Diagram Of Business Environment Showing The Links Between
- Chart Of Business Environment Factors
- The Venn Diagram Of The Three Business Environment Micro ...
- Business Environment Chart
- Draw A Chart Showing Business Environment
- Flow Chart Of Business Environment
- Show The Chart Of Business Environment
- Business Environment Block Diagrams
- Draw A Chart Of Business Environment Plan
- Flow Chart Of The Components Of Business Environment
- Diagram Showing Business Environment
- Business Environment Related Drawings
- Flo Chart Of Business Environment
- Flow Chart Of Types Of Business Environment
- Pie Chart Of Elements Of Business Environment
- Business Environments Chart
- The Circular Chart Of The Business Environment