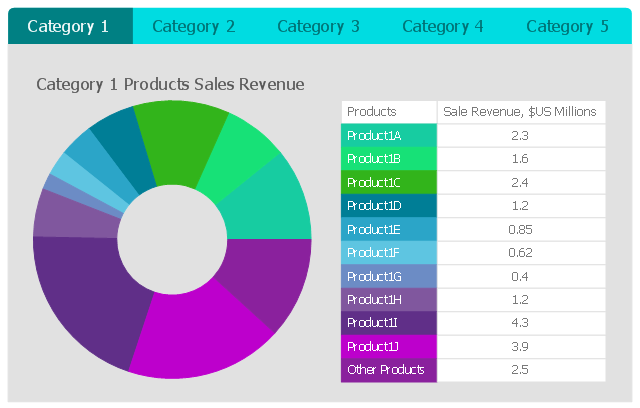
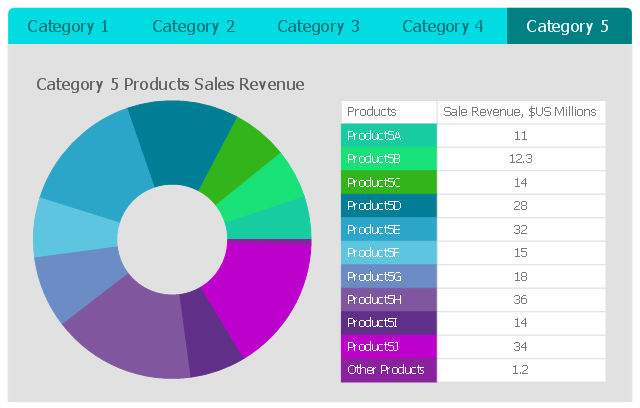
This business intelligence dashboard sample shows the quarter sales revenue for top 10 products by categories using donut charts.
"A doughnut chart (also spelled donut) is a variant of the pie chart, with a blank center allowing for additional information about the data as a whole to be included." [Pie chart. Wikipedia]
The BI dashboard example "Quarter Sales Revenue for Top 10 Products by Categories" was created using ConceptDraw PRO software extended with the Business Intelligence Dashboards solution from the Business Processes area of ConceptDraw Solution Park.
Category 1
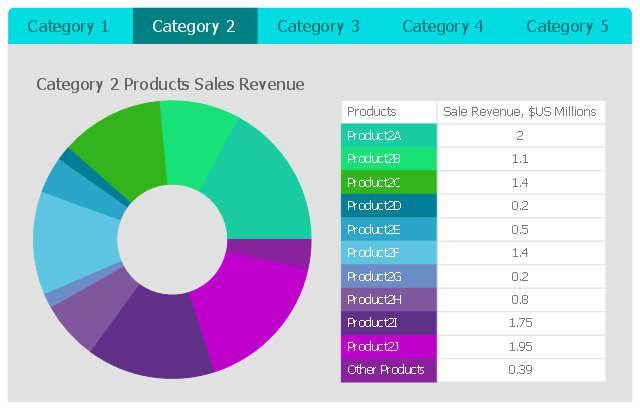
Category 2
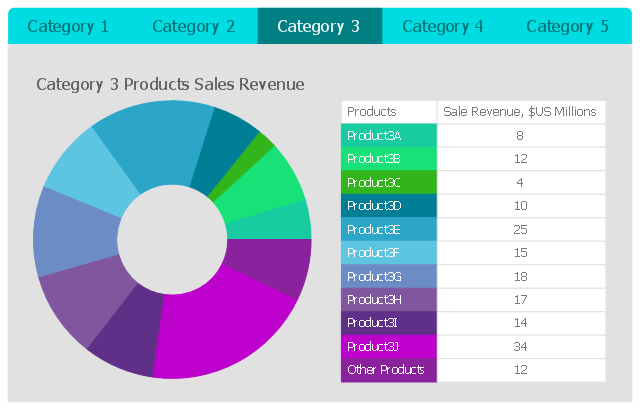
Category 3
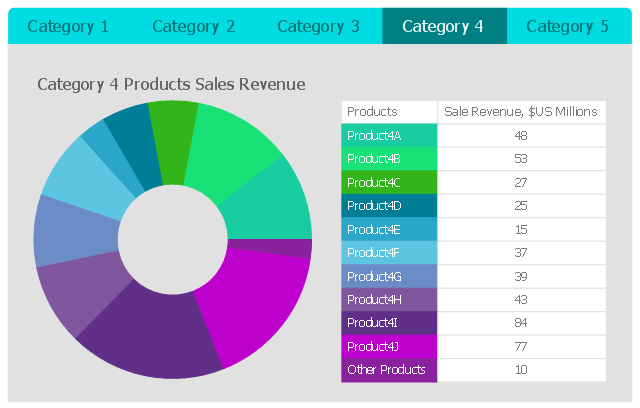
Category 4
Category 5
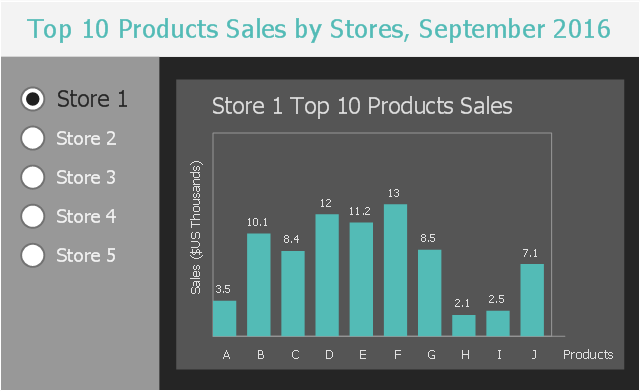
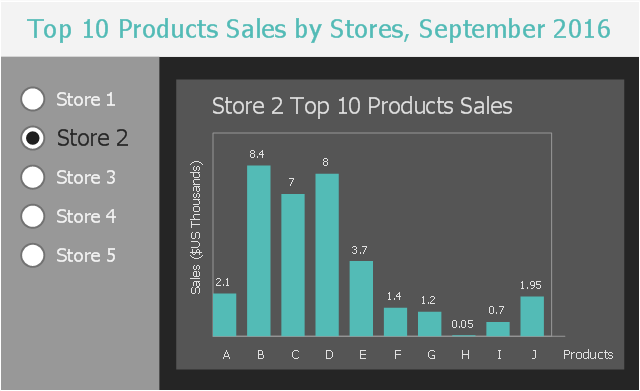
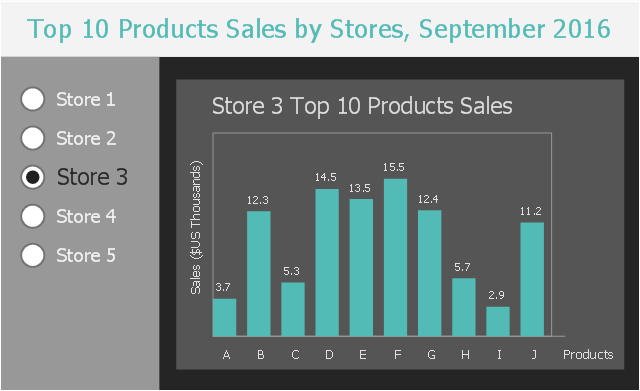
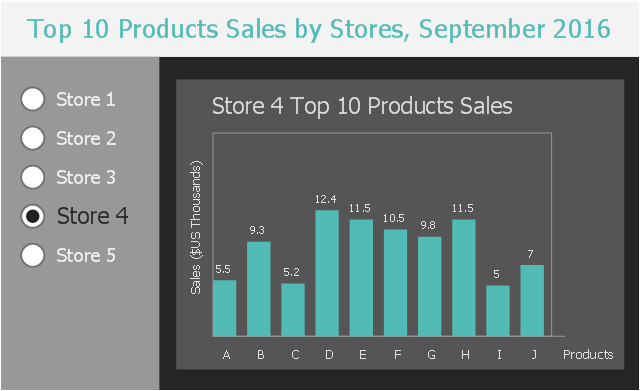
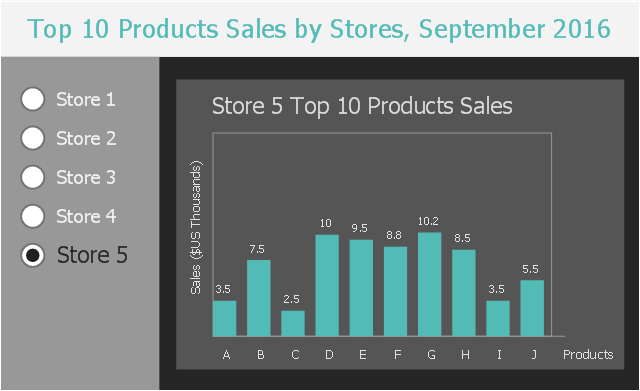
This business intelligence dashboard sample shows the top 10 products sales by stores in September, 2016 using vertical bar charts.
"Bar graphs/ charts provide a visual presentation of categorical data. Categorical data is a grouping of data into discrete groups, such as months of the year, age group, shoe sizes, and animals. These categories are usually qualitative. In a column bar chart, the categories appear along the horizontal axis; the height of the bar corresponds to the value of each category." [Bar chart. Wikipedia]
The BI dashboard example "Top 10 Products Sales by Stores, September 2016" was created using ConceptDraw PRO software extended with the Business Intelligence Dashboards solution from the Business Processes area of ConceptDraw Solution Park.
Store 1
Store 2
Store 3
Store 4
Store 5
Pie Chart Software

How to Create a Pie Chart

HelpDesk
How to Draw a Line Chart Quickly

How to Create a Bar Chart

Pyramid Chart Examples

Competitor Analysis

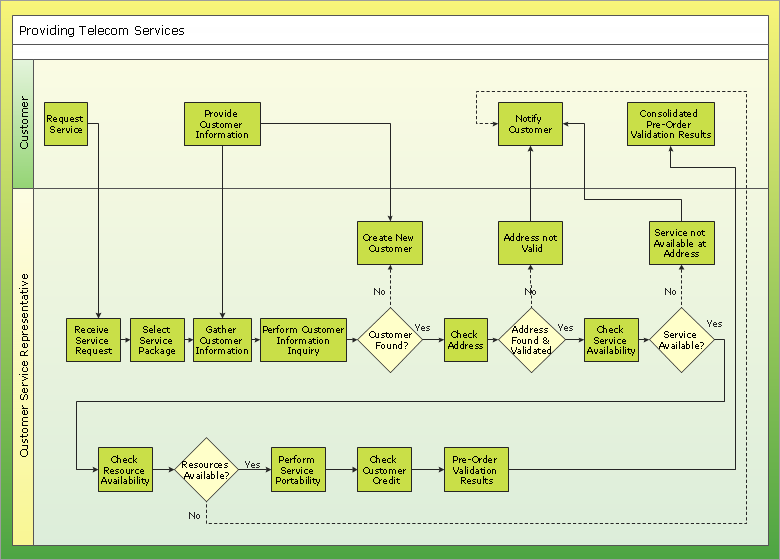
Sales Process Management

It is effective to use professional software for the sales process management. ConceptDraw DIAGRAM diagramming and vector drawing software extended with Sales Flowcharts solution from the Marketing area of ConceptDraw Solution Park is the best choice.
HelpDesk
How to Create a Time Series Dashboard

Percentage Pie Chart. Pie Chart Examples

Pie Graph Worksheets

Picture Graph

Double-headed Cross Functional Flowchart
 Seven Management and Planning Tools
Seven Management and Planning Tools solution extends ConceptDraw DIAGRAM and ConceptDraw MINDMAP with features, templates, samples and libraries of vector stencils for drawing management mind maps and diagrams.
- Pie Chart Examples and Templates | Donut Chart Templates ...
- Chart Maker for Presentations | Bar Chart Examples | Sales Growth ...
- Sales revenue - Dashboard | Business Intelligence Dashboard ...
- How to Create a Bar Chart in ConceptDraw PRO | Bar Diagrams for ...
- Bar Chart Examples | Bar Graphs | Sales Growth. Bar Graphs ...
- Customer Categories
- Bar Chart Examples | Sales Growth. Bar Graphs Example | Column ...
- How to Draw a Divided Bar Chart in ConceptDraw PRO | Divided ...
- How to Draw a Divided Bar Chart in ConceptDraw PRO | UK Map ...
- Sales Dashboard | Dashboard | Sales revenue - Dashboard ...
- Bar Graphs | Sales Growth. Bar Graphs Example | Bar Graph | Make ...
- Quarter Sales Revenue for Top 10 Products by Categories
- Organizational Chart Templates | Sales Growth. Bar Graphs ...
- Bar Graph | Picture graphs - Vector stencils library | Sales Growth ...
- Double bar graph - Template
- Pyramid Chart Examples | How to Make SWOT Analysis in a Word ...
- Sample Marketing Flow Chart
- Sales Growth. Bar Graphs Example | Bar Chart Examples | Bar ...
- Sales Growth. Bar Graphs Example | Bar Diagrams for Problem ...
- Bar Graphs | Sales Growth. Bar Graphs Example | Bar Diagrams for ...