Flowchart design. Flowchart symbols, shapes, stencils and icons


Example of DFD for Online Store (Data Flow Diagram)


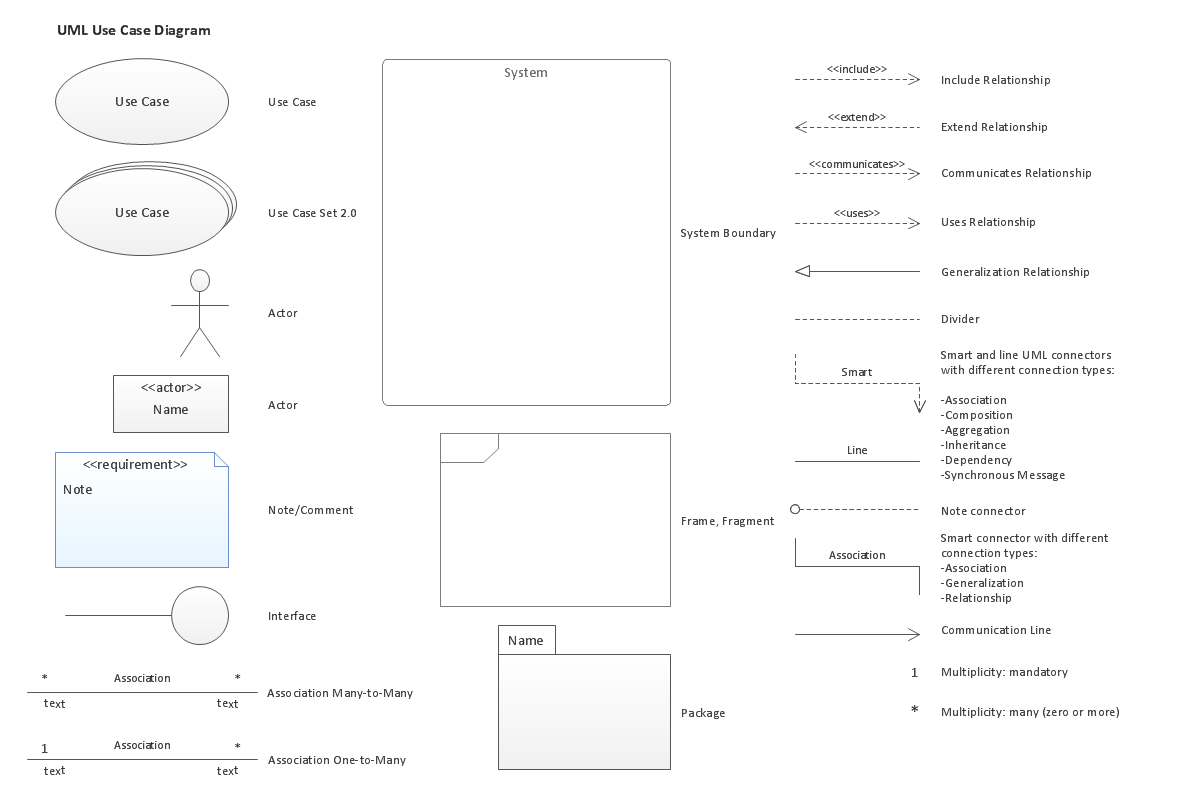
UML Use Case Diagram. Design Elements

Sales Process
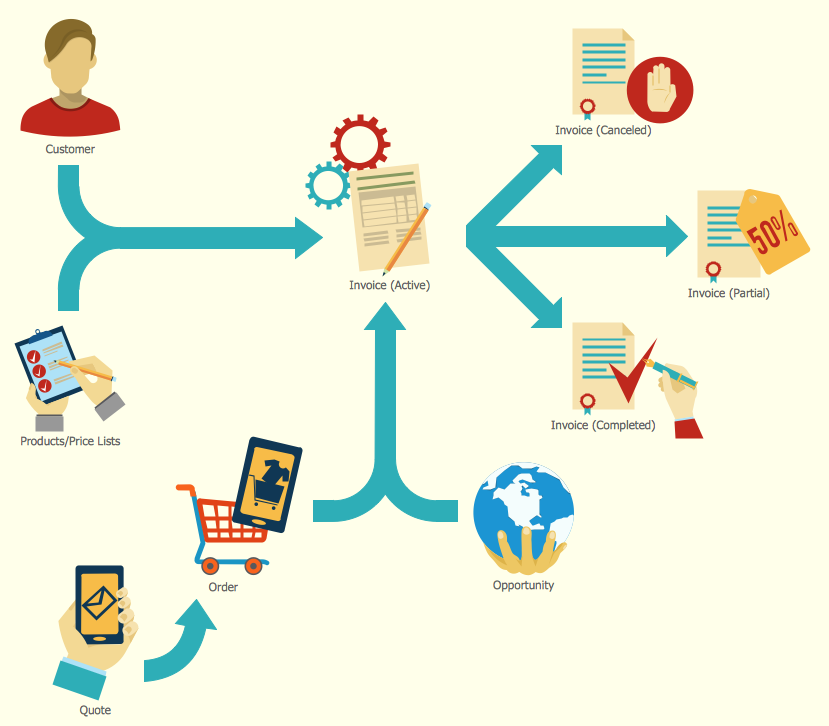
Sales Process Steps

Settlement Process Flowchart. Flowchart Examples
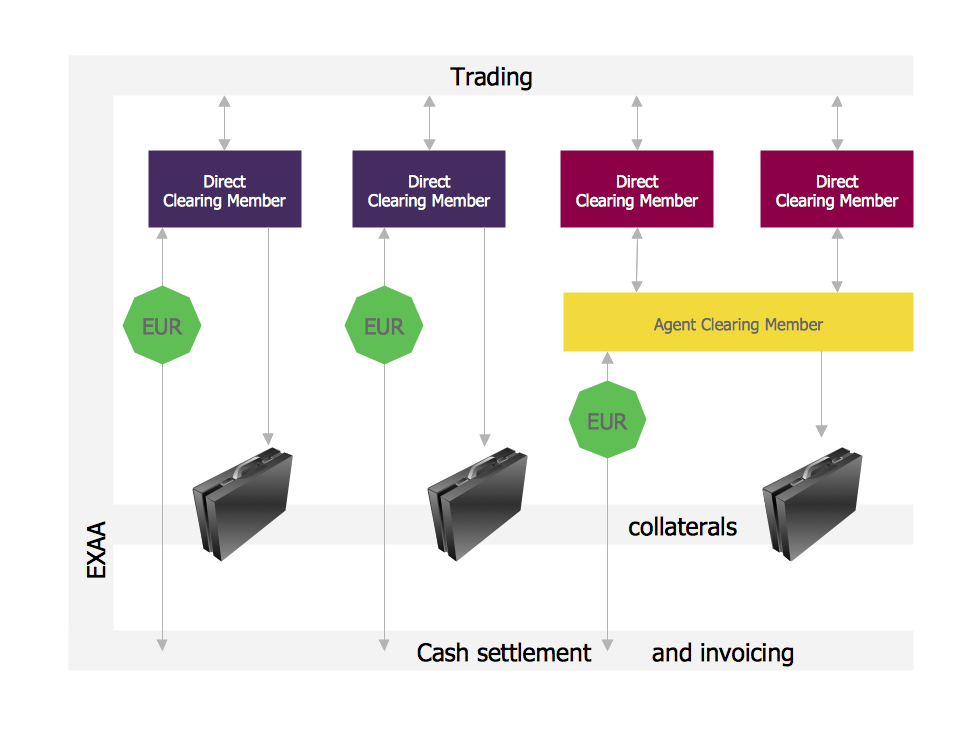
Accounting Flowchart Purchasing Receiving Payable and Payment

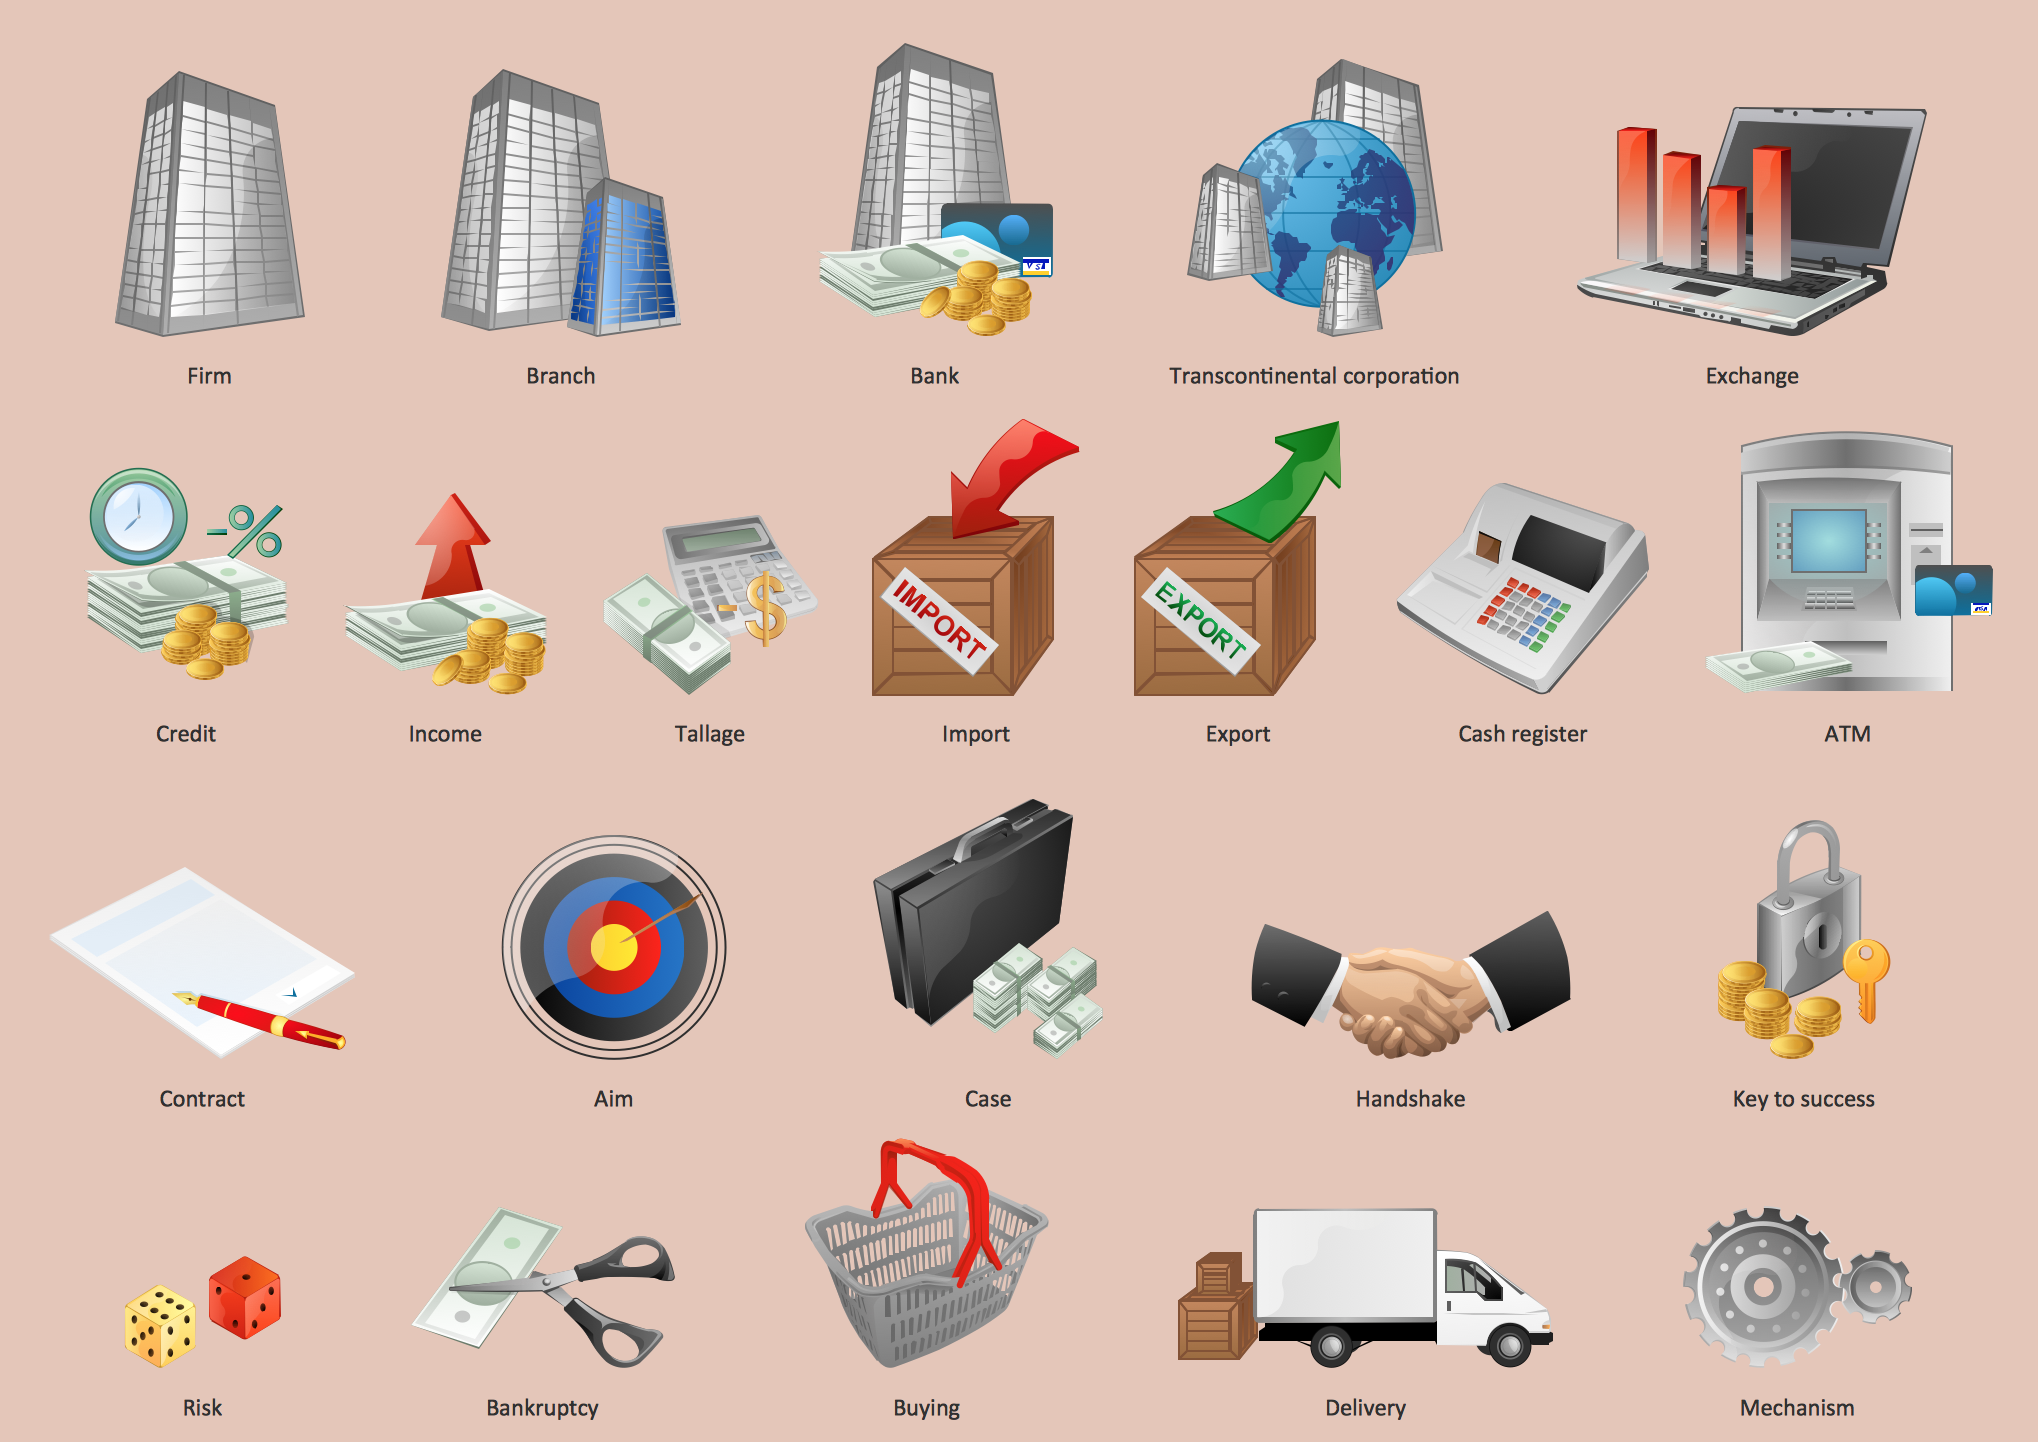
Business - Design Elements
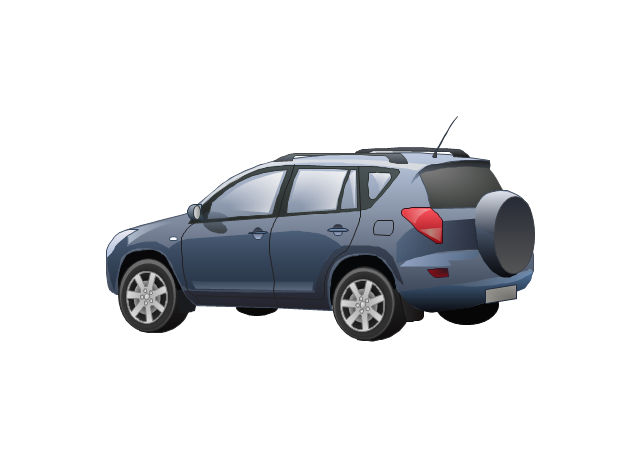
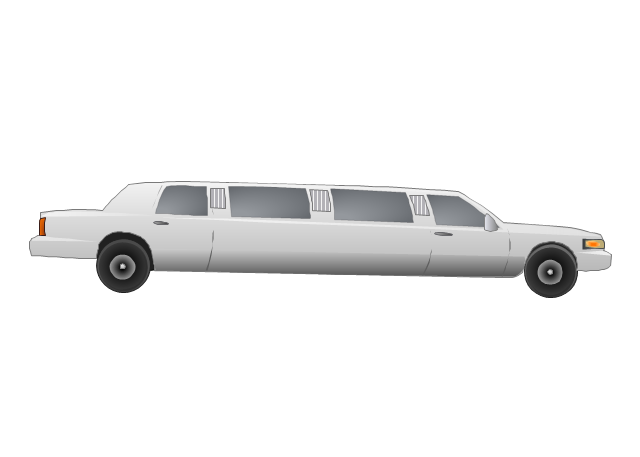
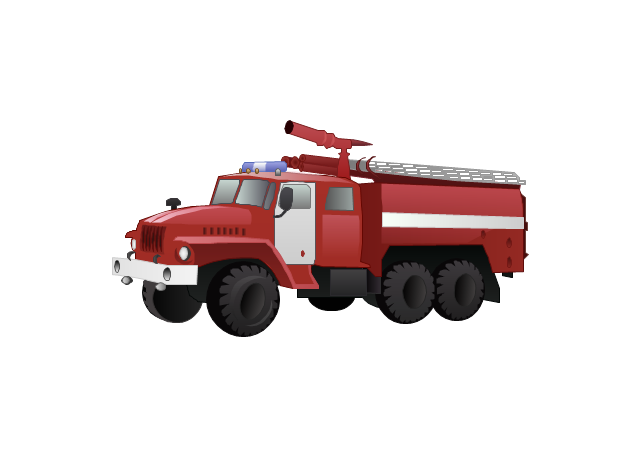
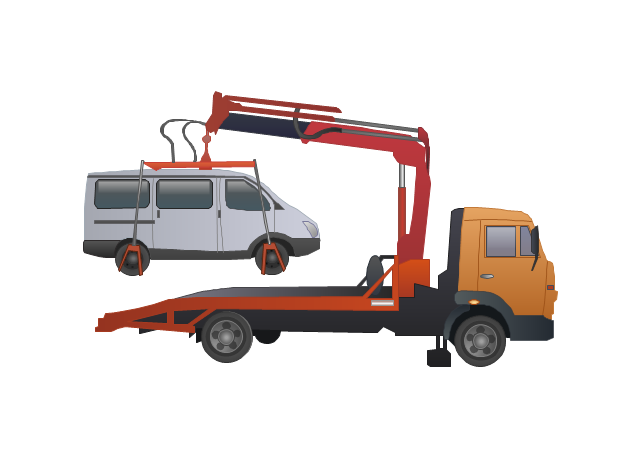
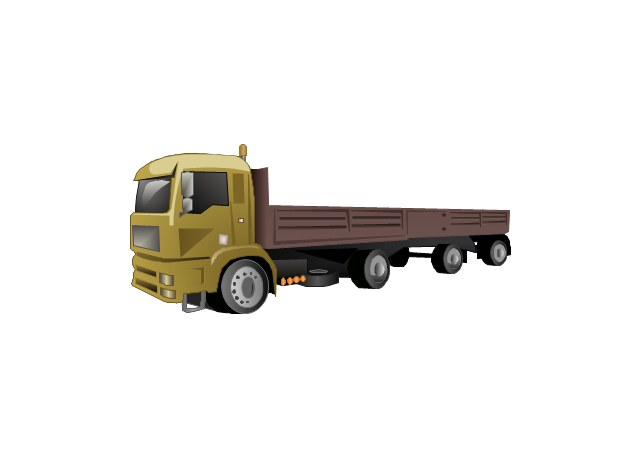
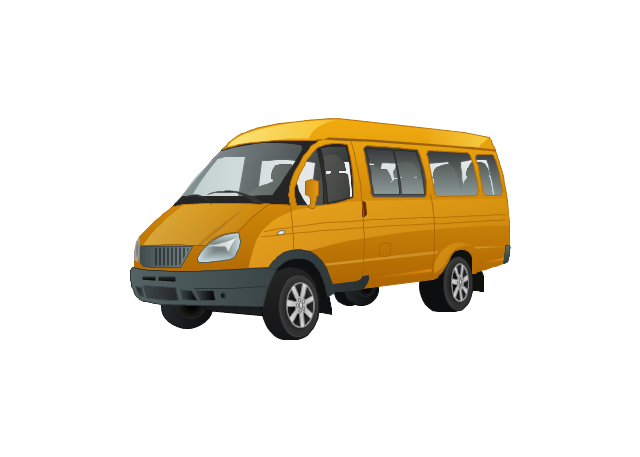
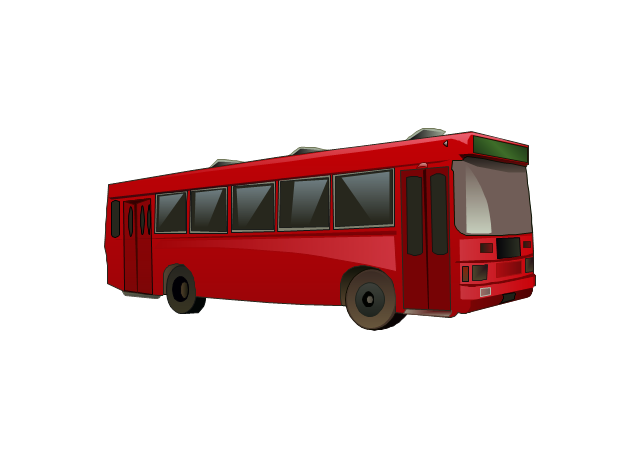
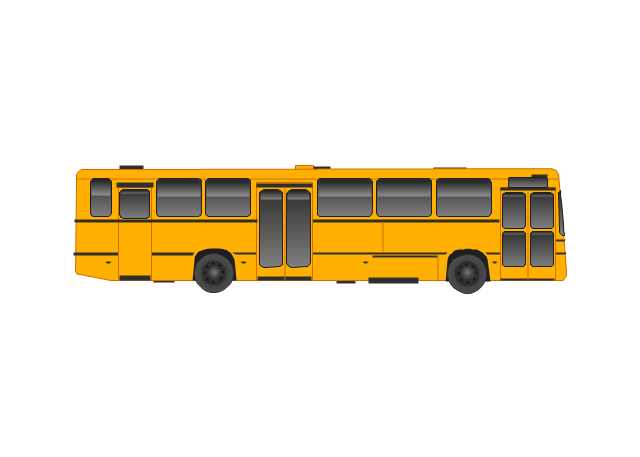
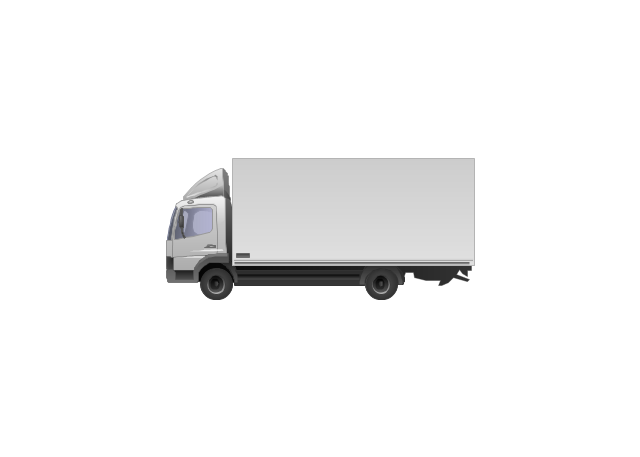
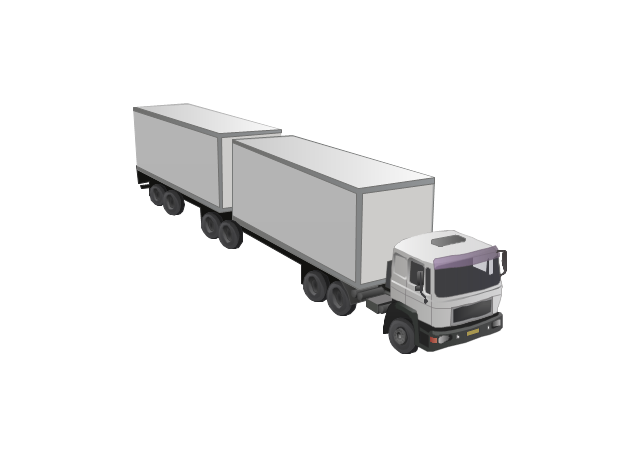
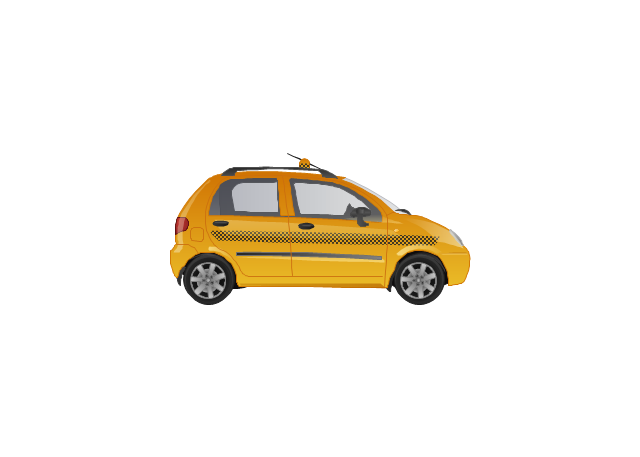
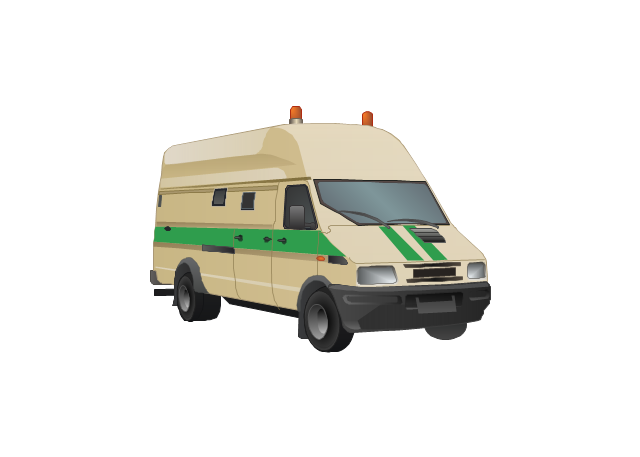
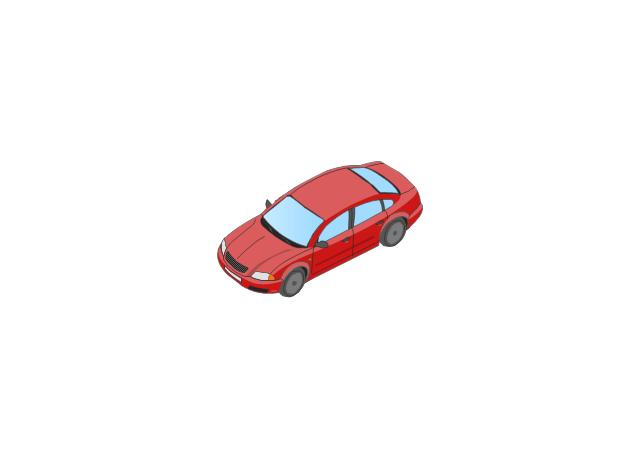
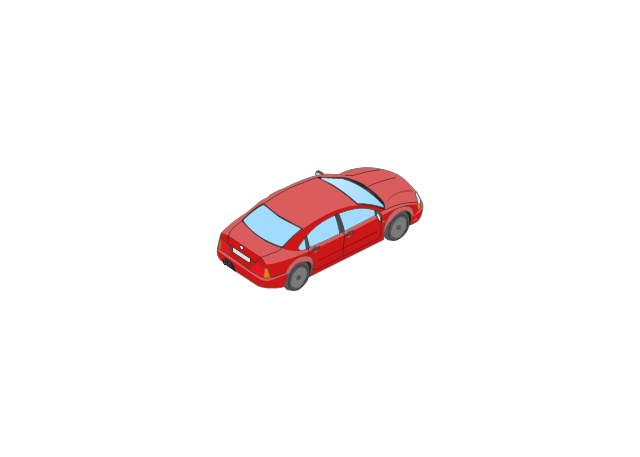
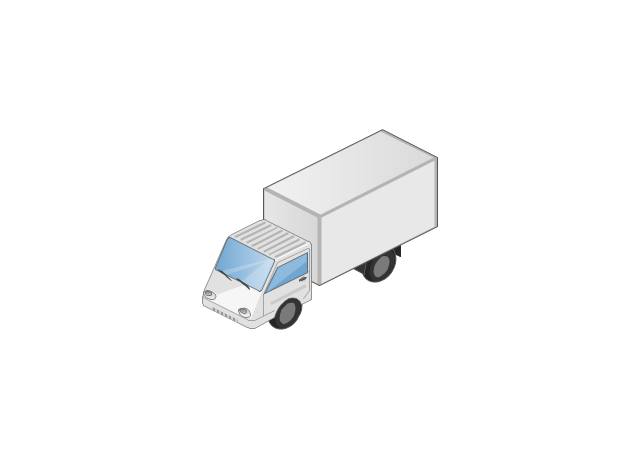
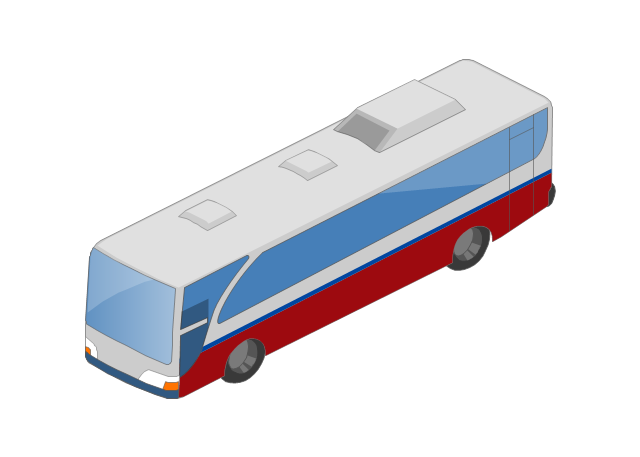
The vector stencils library "Road transport" contains 43 clip art images for creating vehicles and transportation illustrations, presentation slides, infographics and webpages using the ConceptDraw PRO diagramming and vector drawing software.
"Road transport (British English) or road transportation (American English) is the transport of passengers or goods on roads. ...
Transportation.
Transport on roads can be roughly grouped into the transportation of goods and transportation of people. In many countries licencing requirements and safety regulations ensure a separation of the two industries.
The nature of road transportation of goods depends, apart from the degree of development of the local infrastructure, on the distance the goods are transported by road, the weight and volume of the individual shipment, and the type of goods transported. For short distances and light, small shipments a van or pickup truck may be used. For large shipments even if less than a full truckload a truck is more appropriate. In some countries cargo is transported by road in horse-drawn carriages, donkey carts or other non-motorized mode. Delivery services are sometimes considered a separate category from cargo transport. In many places fast food is transported on roads by various types of vehicles. For inner city delivery of small packages and documents bike couriers are quite common.
People are transported on roads either in individual cars or automobiles, or in mass transit by bus or coach. Special modes of individual transport by road like rickshaws or velotaxis may also be locally available." [Road transport. Wikipedia]
The vector stencils library "Road transport" is included in the Aerospace and Transport solution from the Illustrations area of ConceptDraw Solution Park.
www.conceptdraw.com/ solution-park/ illustrations-aerospace-transport
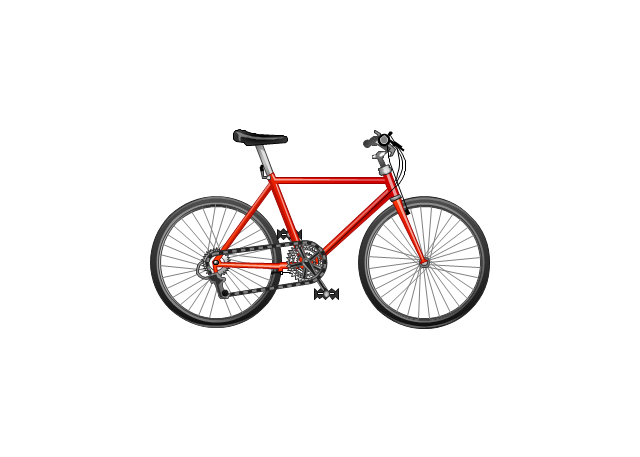
Bicycle
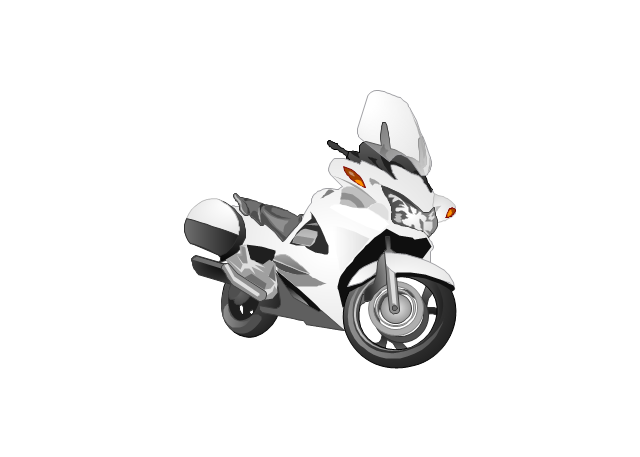
Motorcycle
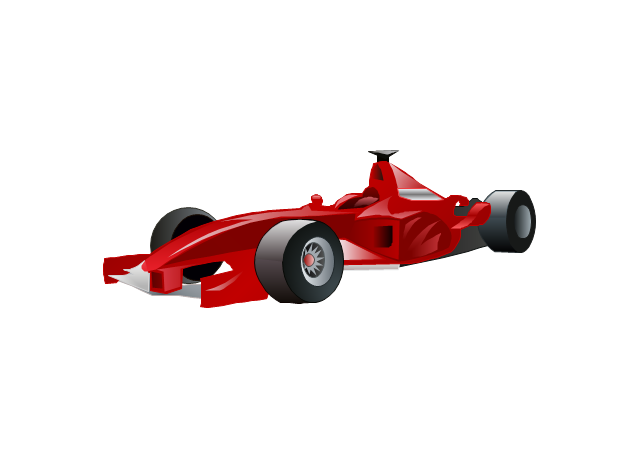
Race car
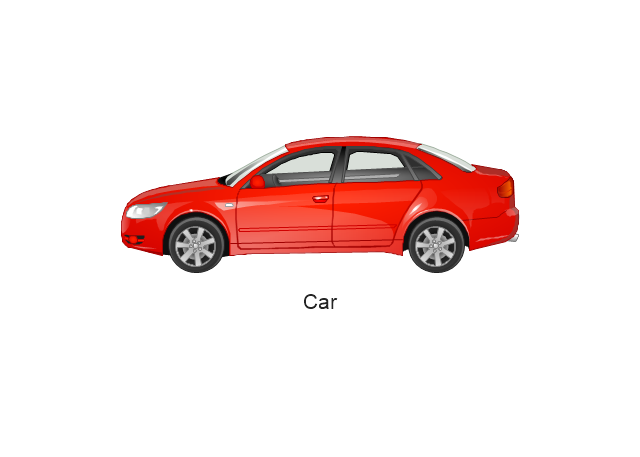
Car
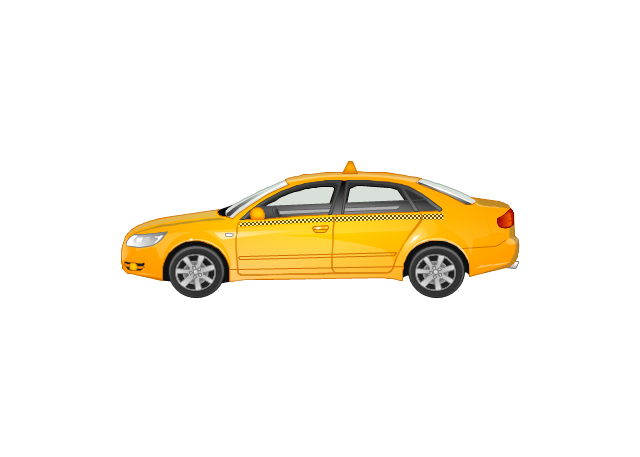
Taxi
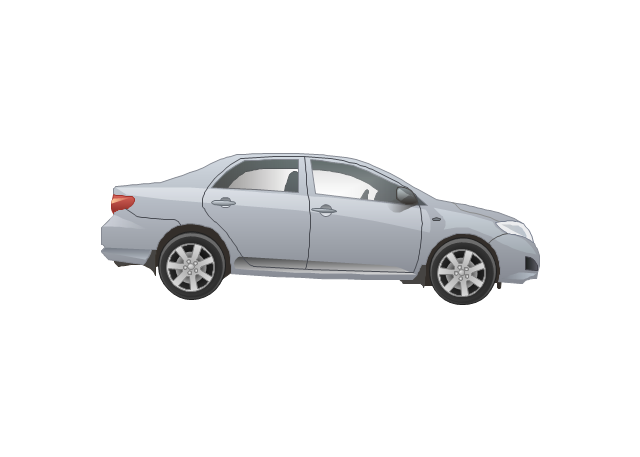
Sedan
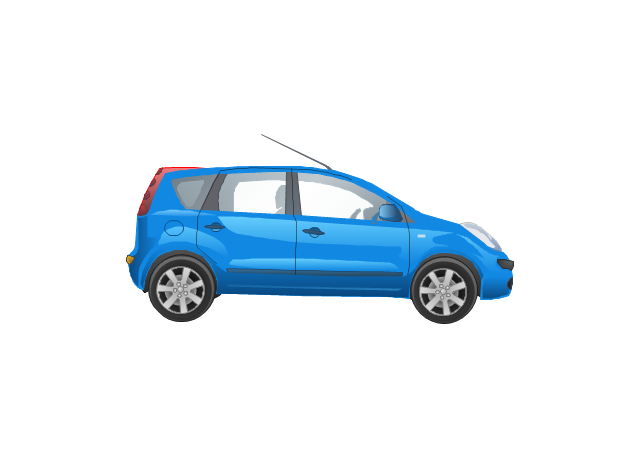
Hatchback
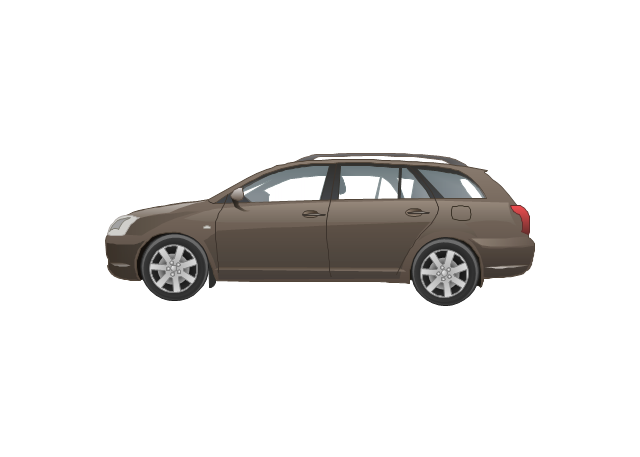
Estate car
4x4
Limousine
Police car

Ambulance

Fire apparatus
Wrecker
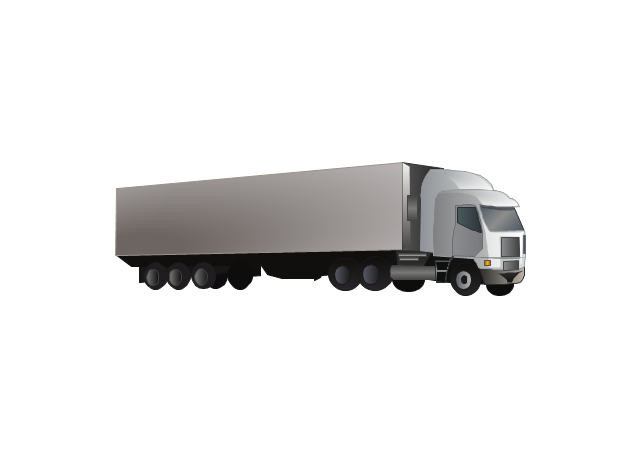
Semi truck

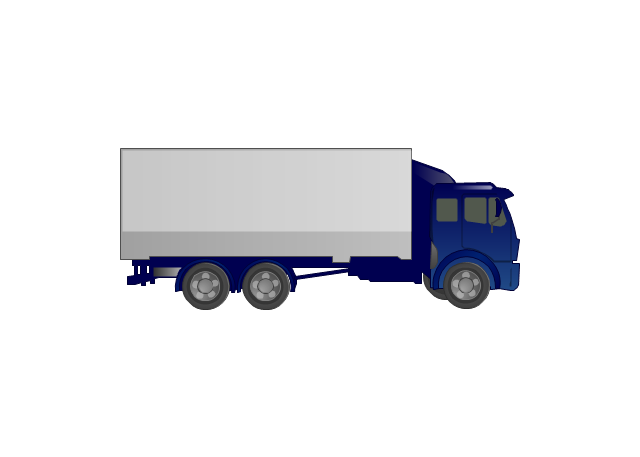
Truck
Trailer
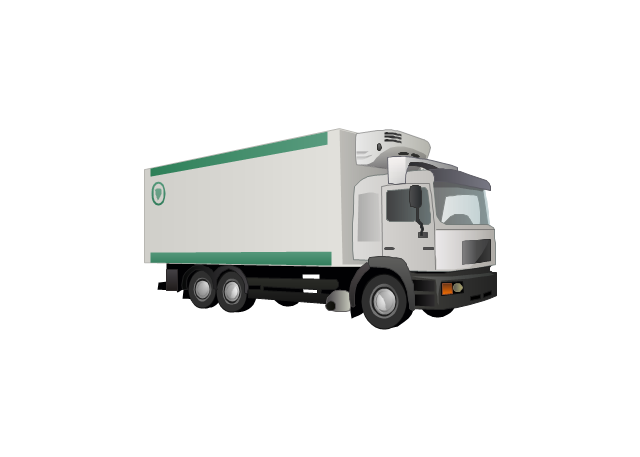
Refrigeration Truck
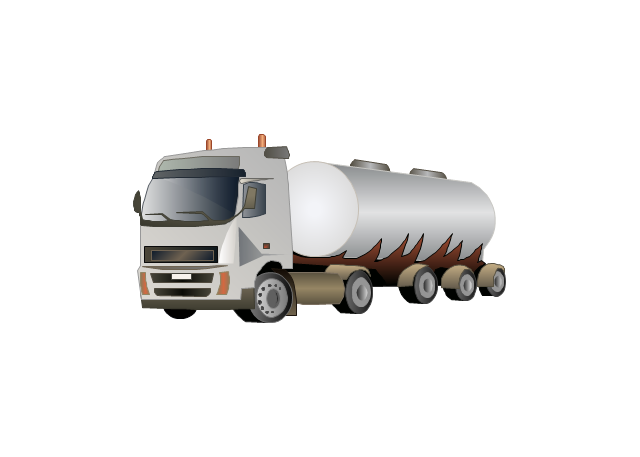
Petrol Tanker
Truck
Minibus
City Bus
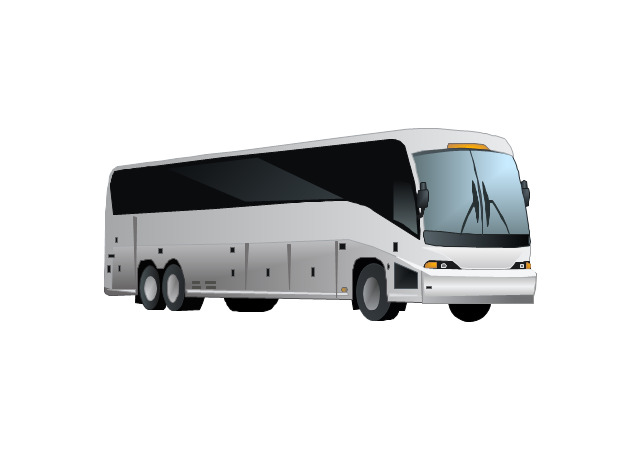
Bus
Sightseeing Bus
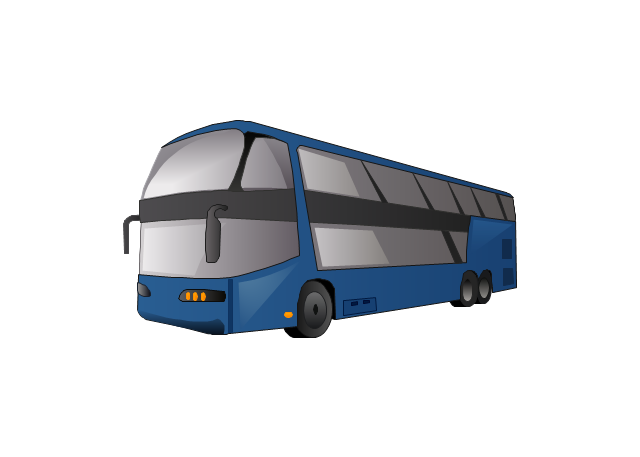
Double-decker Bus
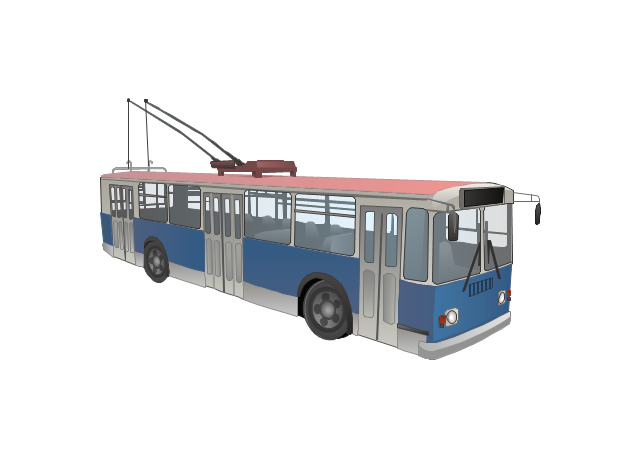
Trolleybus
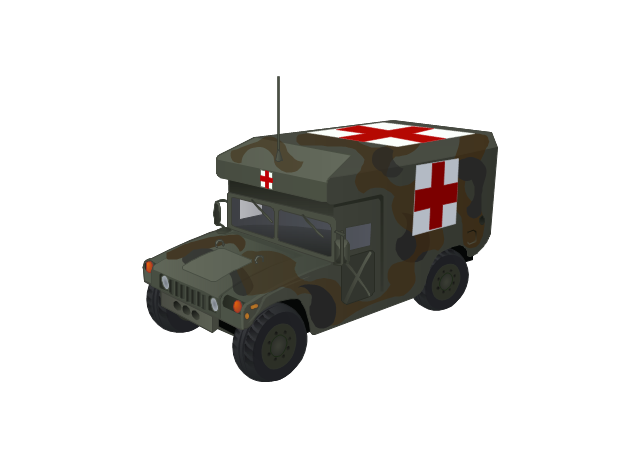
Military Ambulance
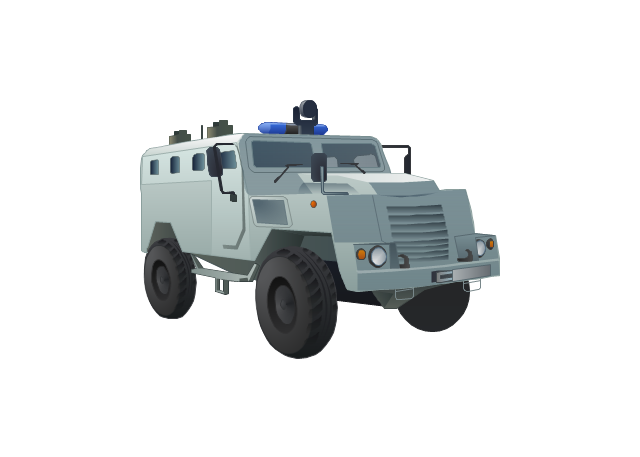
Armored police vehicle
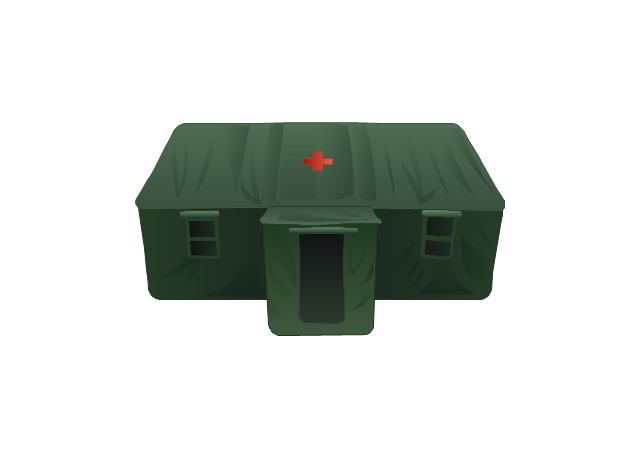
First Aid Tent
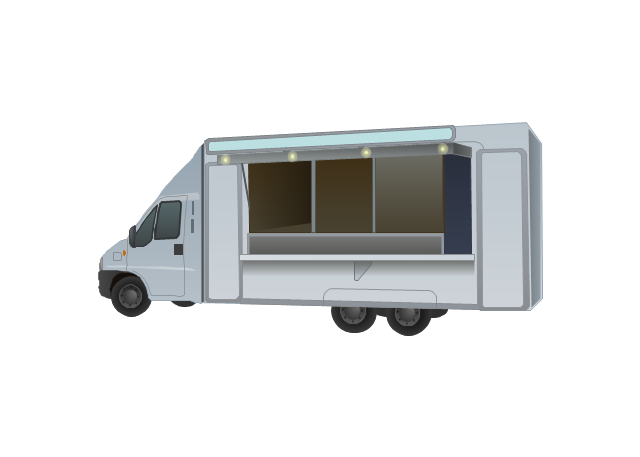
Catering Vehicle
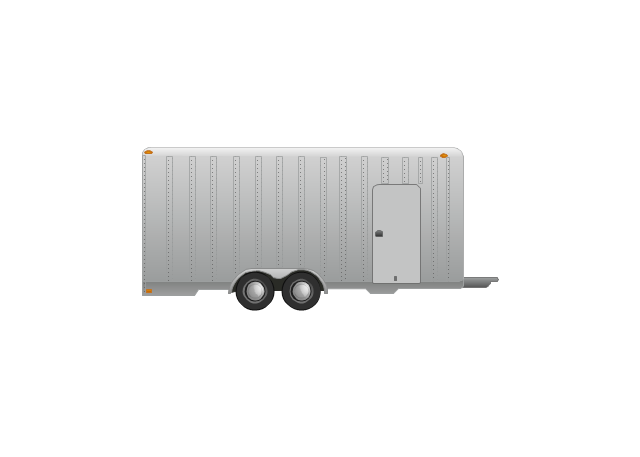
Semi-trailer
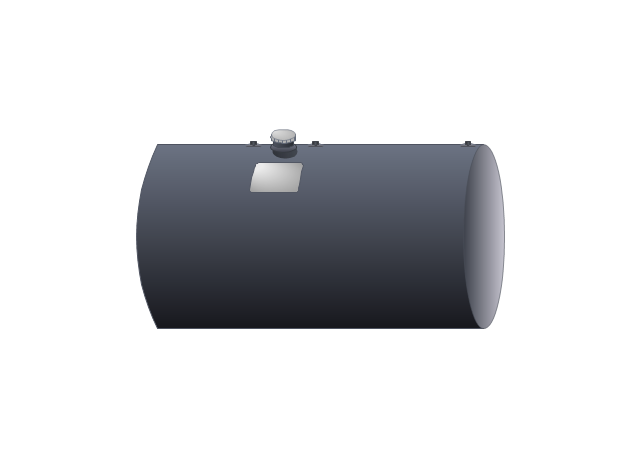
Fuel Tank
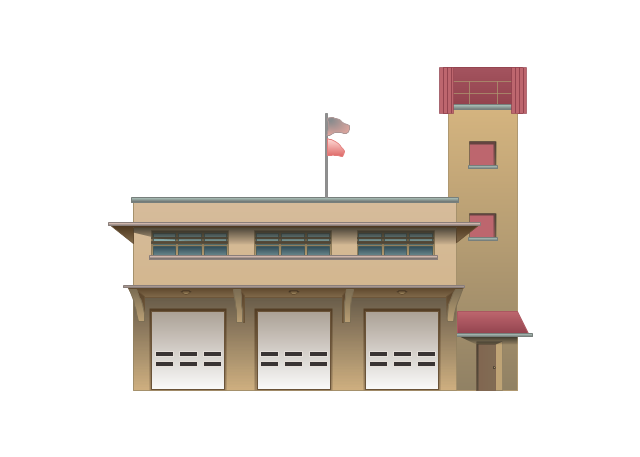
Fire Station
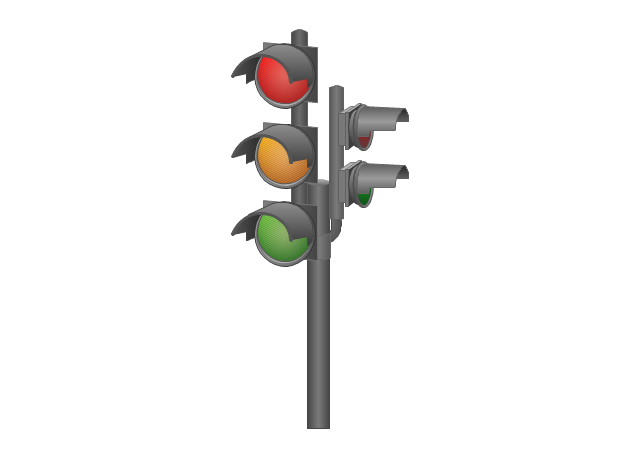
Signal Light
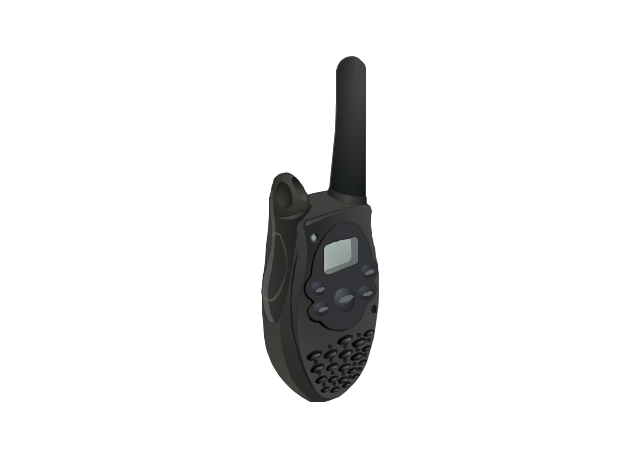
Walkie-Talkie
Lorry
B-Train
Taxi
Armored cash transport car
Car isometric
Car isometric
Box truck isometric
Bus isometric
 Fishbone Diagrams
The Fishbone Diagrams solution extends ConceptDraw DIAGRAM software with the ability to easily draw the Fishbone Diagrams (Ishikawa Diagrams) to clearly see the cause and effect analysis and also problem solving. The vector graphic diagrams produced using this solution can be used in whitepapers, presentations, datasheets, posters, and published technical material.
 Business Package for Management
Package intended for professional who designing and documenting business processes, preparing business reports, plan projects and manage projects, manage organizational changes, prepare operational instructions, supervising specific department of an organization, workout customer service processes and prepare trainings for customer service personal, carry out a variety of duties to organize business workflow.
 Cross-Functional Flowcharts
Cross-functional flowcharts are powerful and useful tool for visualizing and analyzing complex business processes which requires involvement of multiple people, teams or even departments. They let clearly represent a sequence of the process steps, the order of operations, relationships between processes and responsible functional units (such as departments or positions).
ConceptDraw DIAGRAM The best Business Drawing Software

 Sales Flowcharts
The Sales Flowcharts solution lets you create and display sales process maps, sales process workflows, sales steps, the sales process, and anything else involving sales process management.
 Business Process Diagrams
Business Process Diagrams solution extends the ConceptDraw DIAGRAM BPM software with RapidDraw interface, templates, samples and numerous libraries based on the BPMN 1.2 and BPMN 2.0 standards, which give you the possibility to visualize equally easy simple and complex processes, to design business models, to quickly develop and document in details any business processes on the stages of project’s planning and implementation.
- Road transport - Vector stencils library | Vector Fuel Truck Png Icon
- Fuel Tank Icon Png
- Van Icon Vector Png
- Business - Vector stencils library | Sales Process Flowchart Symbols ...
- Business - Vector stencils library | Workflow diagrams - Vector ...
- Delivery Vector Png
- Cart Icons Png
- Free Transport Icon Set
- Diagramming software for Amazon Web Service icon set ...
- Cash Png
- Road Icon Vector
- Cloud round icons - Vector stencils library | Shopping pictograms ...
- Fishbone Diagrams | Office Layout Plans | Business and Finance ...
- Effects of taxes and benefits | British India salt revenue 1840-1877 ...
- Flowchart design. Flowchart symbols, shapes, stencils and icons ...
- Content Marketing Infographics | Design elements - Content Views ...
- The Action Plan | PROBLEM ANALYSIS. Root Cause Analysis Tree ...
- Growth Icon
- Flowchart design. Flowchart symbols, shapes, stencils and icons ...
- Cash Register