Cause and Effect Diagram

When To Use a Fishbone Diagram

Fishbone Problem Solving Tool

Draw Fishbone Diagram on MAC Software

HelpDesk
How to Add a Fishbone (Ishikawa) Diagram to an MS Word Document
 Diagram to an MS Word Document *")
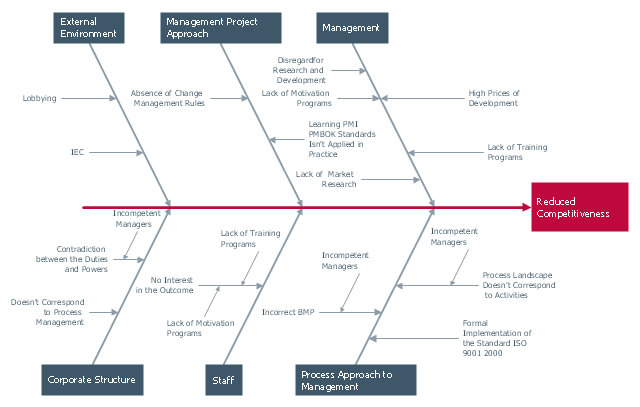
Fishbone Diagram Example

HelpDesk
How to Draw a Fishbone Diagram

Fishbone Diagram Procedure

"Cause-and-effect diagrams can reveal key relationships among various variables, and the possible causes provide additional insight into process behavior.
Causes can be derived from brainstorming sessions. These groups can then be labeled as categories of the fishbone. They will typically be one of the traditional categories mentioned above but may be something unique to the application in a specific case. Causes can be traced back to root causes with the 5 Whys technique." [Ishikawa diagram. Wikipedia]
"The 5 Whys is an iterative question-asking technique used to explore the cause-and-effect relationships underlying a particular problem. The primary goal of the technique is to determine the root cause of a defect or problem. (The "5" in the name derives from an empirical observation on the number of iterations typically required to resolve the problem.)" [5 Whys. Wikipedia]
This Ishikawa diagram (cause and effect diagram) template is included in the Fishbone Diagram solution from the Management area of ConceptDraw Solution Park.
Fishbone diagram

Root Cause Analysis


Total Quality Management Business Diagram

"Cause-and-effect diagrams can reveal key relationships among various variables, and the possible causes provide additional insight into process behavior.
Causes can be derived from brainstorming sessions. These groups can then be labeled as categories of the fishbone. They will typically be one of the traditional categories mentioned above but may be something unique to the application in a specific case. Causes can be traced back to root causes with the 5 Whys technique." [Ishikawa diagram. Wikipedia]
The Ishikawa diagram (cause and effect diagram, fishbone diagram) example "Factors reducing competitiveness" was created using the ConceptDraw PRO diagramming and vector drawing software extended with the Fishbone Diagrams solution from the Management area of ConceptDraw Solution Park.
Ishikawa diagram
Fishbone Diagram Template

Fishbone Diagram

Fishbone Diagram

Pyramid Diagram

Root Cause Tree Diagram

Marketing Analysis Diagram

Communication Tool for Remote Project Management

 Seven Basic Tools of Quality
Manage quality control in the workplace, using fishbone diagrams, flowcharts, Pareto charts and histograms, provided by the Seven Basic Tools of Quality solution.
- Fishbone Diagrams | Blank Calendar Template | Cause and Effect ...
- Fishbone diagram - Causes of low-quality output | Fishbone ...
- Fishbone Diagram Problem Solving | Human Resource ...
- Fishbone Diagrams | How Do Fishbone Diagrams Solve ...
- Ishikawa fishbone diagram | Fishbone diagram - Bad coffee | Cause ...
- Cause and effect diagram - Increase in productivity | Fishbone ...
- When To Use a Fishbone Diagram | Fishbone Diagram Template ...
- Cause and Effect Analysis | Problem solving | Using Fishbone ...
- Cause And Effect Diagram In Coffee Shop
- Cause and Effect Diagrams | Cause and Effect Analysis - Fishbone ...
- When To Use a Fishbone Diagram | Fishbone Diagram Design ...
- How Do Fishbone Diagrams Solve Manufacturing Problems | Cause ...
- Cause and Effect Analysis - Fishbone Diagrams for Problem Solving ...
- How To Create a MS Visio Cause and Effect Diagram Using ...
- Accounts Payable Flowchart | Fishbone Diagram Procedure ...
- Using Fishbone Diagrams for Problem Solving | Cause and Effect ...
- Fishbone Diagrams | Draw Fishbone Diagram on MAC Software ...
- How To Create Cause and Effect ( Fishbone ) Diagram in MS Visio ...
- How Do Fishbone Diagrams Solve Manufacturing Problems ...
- Fishbone diagram - HAN project | Relations diagram - Health care ...