Process Flowchart


Basic Flowchart Symbols and Meaning


Business Process Elements: Activities
")

HelpDesk
How to Draw a Process Flow Diagram in ConceptDraw PRO

How to do presentation of Mind Maps via Skype conference call?

Flow chart Example. Warehouse Flowchart


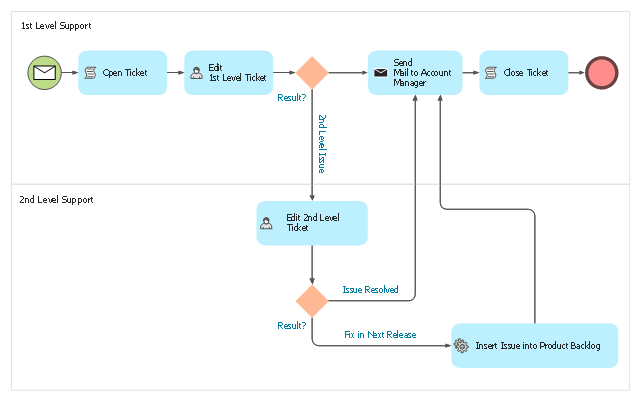
This BPMN (Business Process Model and Notation) diagram sample illustrates the issue tracking system workflow.
"An issue tracking system (also ITS, trouble ticket system, support ticket, request management or incident ticket system) is a computer software package that manages and maintains lists of issues, as needed by an organization. Issue tracking systems are commonly used in an organization's customer support call center to create, update, and resolve reported customer issues, or even issues reported by that organization's other employees. An issue tracking system often also contains a knowledge base containing information on each customer, resolutions to common problems, and other such data. An issue tracking system is similar to a "bugtracker", and often, a software company will sell both, and some bugtrackers are capable of being used as an issue tracking system, and vice versa. Consistent use of an issue or bug tracking system is considered one of the "hallmarks of a good software team".
A ticket element, within an issue tracking system, is a running report on a particular problem, its status, and other relevant data. They are commonly created in a help desk or call center environment and almost always have a unique reference number, also known as a case, issue or call log number which is used to allow the user or help staff to quickly locate, add to or communicate the status of the user's issue or request.
These tickets are so called because of their origin as small cards within a traditional wall mounted work planning system when this kind of support started. Operators or staff receiving a call or query from a user would fill out a small card with the user's details and a brief summary of the request and place it into a position (usually the last) in a column of pending slots for an appropriate engineer, so determining the staff member who would deal with the query and the priority of the request." [Issue tracking system. Wikipedia]
The business process modeling diagram example "Trouble ticket system - BPMN 2.0 diagram" was designed using the ConceptDraw PRO diagramming and vector drawing software extended with the Business Process Diagram solution from the Business Processes area of ConceptDraw Solution Park.
Business process modeling
BPR Diagram. Business Process Reengineering Example

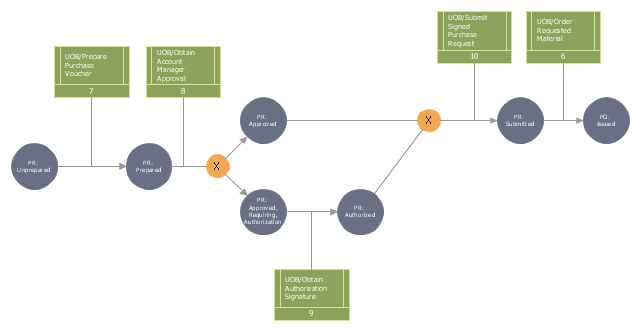
This IDEF3 diagram example was redesigned from the Wikimedia Commons file: 2-02 Example of a Transition Schematic.jpg.
[commons.wikimedia.org/ wiki/ File:2-02_ Example_ of_ a_ Transition_ Schematic.jpg]
"The schematic in Figure 2-2 represents an Object Schematic for the Order Material scenario derived from the business owner’s description. This example happens to illustrate a Transition Schematic since it characterizes the nature and structure of object state transitions for occurrences of the Order Material scenario. A key document in this process is the Purchase Request form. This form is eventually transformed into a Purchase Order (PO) via the Order Material process. A circle containing the name of an object represents an object of a certain kind (e.g., Purchase Request, Account Manager, Project). These labeled circles are known as kind symbols. A certain kind of object being in a certain state is represented by a circle with a label that captures both the kind itself and a corresponding state, thereby representing the type (or class) of objects that are in that state (within a given process). ... One of the first steps to develop an Object Schematic is to identify the possible states in which the object can exist. Though a real-world object often evolves through a continuum of states, an Object Schematic focuses on those distinguished states of particular interest to the domain expert. The transition arcs (arrows with triangular, filled-in heads) connecting the circles symbolize a state transition, the activity of changing from one state to another. The conditions that establish when an object is in a given state, how it exists a state, how it can transition between states, and how it can enter a new state are recorded on a special form. The banded boxes linked to the arrows (called referents) are aids to describe the relationships between objects states and UOBs, scenarios, or other Transition Schematics that participate in a scenario occurrence. ... The transition junctions containing an “X” (for exclusive or) indicate the choice of exactly one path among several possible paths in an occurrence." [IDEF3 Process Description Capture Method Report AL-TR-1995-XXXX. idef.com/ pdf/ Idef3_ fn.pdf]
The diagram "Transition schematic - IDEF3 diagram example" was created using the ConceptDraw PRO diagramming and vector drawing software extended with the solution "IDEF Business Process Diagrams" from the area "Business Processes" of ConceptDraw Solution Park.
IDEF3 business process diagram
IDEF4 Standard

Interactive Voice Response Network Diagram


Bubble diagrams with ConceptDraw PRO

HelpDesk
How to Create a SIPOC Diagram

Types of Flowcharts


Workflow Diagram Software Mac

- Process Flow Chart For A Service Call
- Process Flowchart | Summary Diagram Of A Phone Call Process
- Call Center Process Flow Chart
- Process Flowchart | Telecommunication Network Diagrams | Design ...
- Call Center Work Flow Chart
- Call Center Process Flow Diagram
- Process Flowchart | Store reporting flowchart | Basic Flowchart ...
- Flow Chart Diagram Of A Company From Call Center Industry Using
- Call Processes In A Call Center Visio
- Telecommunication Network Diagrams | Process Flowchart ...
- Call Center Call Flow Diagram
- Taxi Call Center Process Flow Diagram
- Call Flow Diagram Visio Template
- Bpo Call Centre Process Through Diagram
- Flow Chart For Service Call After Sales
- Call center network diagram | How to Draw a Computer Network ...
- Computer and Networks Area | Process Flowchart | Interactive Voice ...
- Process Flowchart | Interactive Voice Response Diagrams | Flow ...
- Call center network diagram | IVR Network Diagram | Interactive ...
- Store reporting flowchart | Interactive Voice Response Diagrams ...