BPR Diagram. Business Process Reengineering Example

Business Processes description with ConceptDraw PRO

Data Flow Diagram

HelpDesk
How the Project Data from Mind Map is Transformed by ConceptDraw PROJECT

Cross Functional Flowchart for Business Process Mapping

Basic Flowchart Symbols and Meaning


HelpDesk
How to Add a Block Diagram to a PowerPoint Presentation

Database Design

Workflow Diagram Software Mac

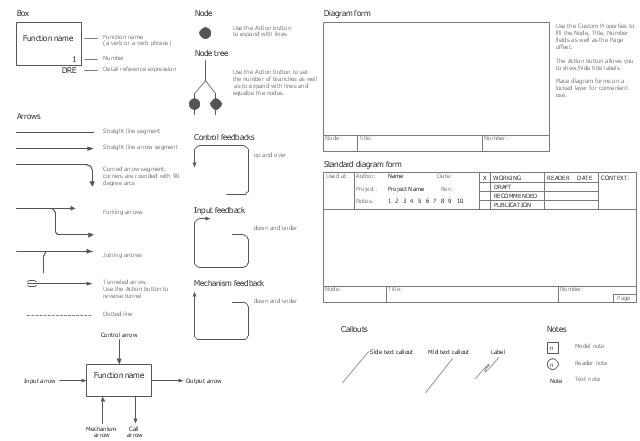
The vector stencils library "IDEF0" contains 26 IDEF0 diagram symbols.
Use it for business process modeling with IDEF0 diagrams.
"The IDEF0 model ... is based on a simple syntax. Each activity is described by a verb-based label placed in a box. Inputs are shown as arrows entering the left side of the activity box while output are shown as exiting arrows on the right side of the box. Controls are displayed as arrows entering the top of the box and mechanisms are displayed as arrows entering from the bottom of the box. Inputs, Controls, Outputs, and Mechanisms are all referred to as concepts.
- Arrow: A directed line, composed of one or more arrow segments, that models an open channel or conduit conveying data or objects from source (no arrowhead) to use (with arrowhead). There are 4 arrow classes: Input Arrow, Output Arrow, Control Arrow, and Mechanism Arrow (includes Call Arrow). See Arrow Segment, Boundary Arrow, Internal Arrow.
- Box: A rectangle, containing a name and number, used to represent a function.
- Context: The immediate environment in which a function (or set of functions on a diagram) operates.
- Decomposition: The partitioning of a modeled function into its component functions.
- Fork: The junction at which an IDEF0 arrow segment (going from source to use) divides into two or more arrow segments. May denote unbundling of meaning.
- Function: An activity, process, or transformation (modeled by an IDEF0 box) identified by a verb or verb phrase that describes what must be accomplished.
- Join: The junction at which an IDEF0 arrow segment (going from source to use) merges with one or more other arrow segments to form a single arrow segment. May denote bundling of arrow segment meanings.
- Node: A box from which child boxes originate; a parent box. See Node Index, Node Tree, Node Number, Node Reference, Diagram Node Number." [IDEF0. Wikipedia]
The shapes example "Design elements - IDEF0" was created using the ConceptDraw PRO diagramming and vector drawing software extended with the solution "IDEF Business Process Diagrams" from the area "Business Processes" of ConceptDraw Solution Park.
IDEF0 diagram symbols
IDEF0 standard with ConceptDraw PRO

Process Flow Chart

Example of DFD for Online Store (Data Flow Diagram) DFD Example


Data modeling with ConceptDraw PRO

- IDEF | IDEF Business Process Diagrams | How to Create an IDEF0 ...
- Business Process Management | Sales Process Management ...
- Workflow Diagrams | Cross-Functional Flowcharts | Business ...
- Business Processes | IDEF3 Standard | IDEF0 standard with ...
- Diagrams Of Energy Transformation To Draw
- Business Process Management | Process Flowchart | Sales Process ...
- IDEF0 standard with ConceptDraw PRO | Business Processes ...
- Sales Process Management | Business Process Reengineering ...
- Program Structure Diagram | IDEF0 Diagrams | Business Processes ...
- ConceptDraw PRO Network Diagram Tool | Diagrama de Topologia ...
- IDEF0 standard with ConceptDraw PRO | IDEF0 Diagrams ...
- Process Flowchart | Business Processes Area | ConceptDraw ...
- How to Create a Data Flow Diagram using ConceptDraw PRO | Data ...
- Drawing The Business Process Context Model Using Idef0
- Business Process Management | Total Quality Management ...
- Program Structure Diagram | ConceptDraw Solution Park | Business ...
- Design elements - Chemical engineering | Transformation ...
- Business Process Elements: Activities | UML Activity Diagram ...
- Business Process Diagram | Business Process Modeling | Business ...
- Project Management Area | PM Presentations | Business Process ...