Pyramid Diagram

Pyramid Diagram

Pyramid Diagram

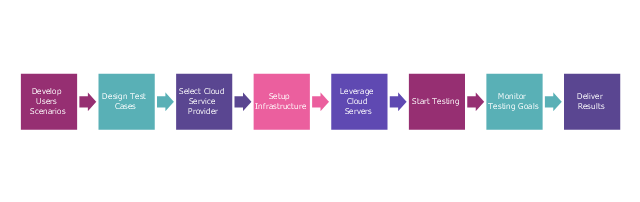
This step diagram example shows cloud testing steps. It was redesigned from the Wikimedia Commons file: Cloud Testing steps.png. [commons.wikimedia.org/ wiki/ File:Cloud_ Testing_ steps.png]
This file is licensed under the Creative Commons Attribution-Share Alike 3.0 Unported license. [creativecommons.org/ licenses/ by-sa/ 3.0/ deed.en]
"Cloud testing is a form of software testing in which web applications use cloud computing environments (a "cloud") to simulate real-world user traffic. ...
Cloud Testing uses cloud infrastructure for software testing. Organizations pursuing testing in general and load, performance testing and production service monitoring in particular are challenged by several problems like limited test budget, meeting deadlines, high costs per test, large number of test cases, and little or no reuse of tests and geographical distribution of users add to the challenges. Moreover ensuring high quality service delivery and avoiding outages requires testing in one's datacenter, outside the data-center, or both. Cloud Testing is the solution to all these problems. Effective unlimited storage, quick availability of the infrastructure with scalability, flexibility and availability of distributed testing environment reduce the execution time of testing of large applications and lead to cost-effective solutions." [Cloud testing. Wikipedia]
The step chart example "Cloud testing steps" was created using the ConceptDraw PRO diagramming and vector drawing software extended with the Marketing Diagrams solution from the Marketing area of ConceptDraw Solution Park.
Marketing diagram
How to Create a Social Media DFD Flowchart

 Pie Charts
Pie Charts are extensively used in statistics and business for explaining data and work results, in mass media for comparison (i.e. to visualize the percentage for the parts of one total), and in many other fields. The Pie Charts solution for ConceptDraw PRO v10 offers powerful drawing tools, varied templates, samples, and a library of vector stencils for simple construction and design of Pie Charts, Donut Chart, and Pie Graph Worksheets.
Process Flowchart


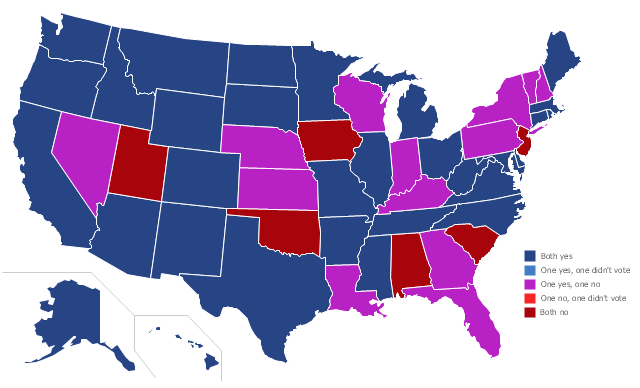
Depiction of the Senate votes on S 365 (Budget Control Act of 2011) on August 2, 2011, by state.
"The Budget Control Act of 2011 (Pub.L. 112–25, S. 365, 125 Stat. 240, enacted August 2, 2011) is a federal statute in the United States that was signed into law by President Barack Obama on August 2, 2011. The Act brought conclusion to the 2011 United States debt-ceiling crisis, which had threatened to lead the United States into sovereign default on or around August 3, 2011.
The law involves the introduction of several complex mechanisms, such as creation of the Congressional Joint Select Committee on Deficit Reduction (sometimes called the "super committee"), options for a balanced budget amendment and automatic budget sequestration." [Budget Control Act of 2011. Wikipedia]
This U.S.A. thematic map was redesigned from Wikimedia Commons file: Budget Control Act of 2011 Senate vote.svg. [commons.wikimedia.org/ wiki/ File:Budget_ Control_ Act_ of_ 2011_ Senate_ vote.svg]
This file is licensed under the Creative Commons Attribution-Share Alike 3.0 Unported license.
[creativecommons.org/ licenses/ by-sa/ 3.0/ deed.en]
The U.S. thematic map example "Senate votes on Budget Control Act of 2011, by state" was created using the ConceptDraw PRO diagramming and vector drawing software extended with the Continent Maps solution from the Maps area of ConceptDraw Solution Park.
U.S. thematic map
Flowchart design. Flowchart symbols, shapes, stencils and icons


Pyramid Diagram

HelpDesk
How to Track Your Project Plan vs. the Actual Project Condition

Project — Working With Costs

HelpDesk
What Information can be Displayed in the Multiproject Dashboard View


The vector stencils library "Management pictograms" contains 72 management pictograms.
Use it to create your management infogram in the ConceptDraw PRO diagramming and vector drawing software.
The flat icons example "Management pictograms - Vector stencils library" is included in the solution "Marketing infographics" from the "Business infographics" area of ConceptDraw Solution Park.
Use it to create your management infogram in the ConceptDraw PRO diagramming and vector drawing software.
The flat icons example "Management pictograms - Vector stencils library" is included in the solution "Marketing infographics" from the "Business infographics" area of ConceptDraw Solution Park.
Accounting management

Activity

Audit management

Board of directors

Budget

Business managemen

Business management tools

Business model

Commanding

Communication

Company

Contract management

Controlling

Coordinating

Core competencies

Corporate strategy

Creativity

Crisis management

Crisis management 2

Decision making

Environmental management

Expenses

External environment

Financial management

Financial management 2

Financial planning

First-level manager

Goal

HR management

Investment management

IT management

Knowledge management

Knowledge management 2

Leadership

Macro environment

Management system

Managerial accounting

Manufacturing management

Market orientation

Marketing management

Marketing strategy

Middle-level manager

Mission

Objectives

Operations management

Organizing

Performance

Performance management

Planning

Policy

PR management

Problem solving

Process management

Product management

Profit

Profit 2

Project management

Quality management

Research and development

Resource management

Resources

Risk management

Sales manegment

Service management

Stakeholder management

Strategic management

Strategic planning

Technology management

Time frame

Time management

Top-level manager

Vision

- Budget Png Logo
- Set Budget Vector Image Png
- Management Chess Icon Png
- Currency - Vector stencils library | Donation Clipart Png
- Dollar Sign In Circular Frame Png Vector
- Cheque Book Png
- Core Competency Png
- Cheque Png
- Technical Competencies Logo Png
- Cheque Png Vector
- Knowledge Vector Png
- Donation Icon Png
- Invest Icon Flat Png
- Crisis Management Icons Png
- Objective Vector Png
- Core Competencies Icon Png
- Vote Png
- Development Operations Flat Png Images
- Investment Logo Png Vector
- How to Draw a Landscape Design Plan | Stair Railing Png