This site uses cookies. By continuing to browse the ConceptDraw site you are agreeing to our Use of Site Cookies.
HelpDesk

How to Create a Bubble Diagram Using ConceptDraw PRO

Bubble Diagram is a simple chart that consists of circles (bubbles) repesening certain topics or processes. Bubbles are connected by lines depicting the type of relationships between the bubbles. The size of each bubble is depended on the importance of the entity it represents. Bubble charts are widely used throughout social, economical, medical, and other scientific researches as well as throughout architecture and business management. Bubble charts are often used during the early stages of product development to visualize thoughts and ideas for the purpose of sketching out a development plan. ConceptDraw PRO allows you to draw a bubble diagrams using the Bubble Diagrams solution.
HelpDesk

How to Add a Bubble Diagram to MS Word

A bubble diagram is used the same purpose as a scatter diagram, but in the case, if the data has three dimensions, each of that containing the set of values. A bubble chart is a diagram in which the data points are replaced with bubbles, and the size of the bubbles represents some additional dimension of the data. A bubble chart does not have the axis. The sizes of the bubbles are determined by the values in the third dimension. Any additional information about the entities beyond their three primary dimensions can be depicted by rendering bubbles in colors and patterns that are selected in a certain way. The legend containing the further information can be added to a bubble diagram. ConceptDraw PRO allows you to easily create various business management and marketing charts, including bubble diagrams and then add them to a MS Word document.
HelpDesk

How to Add a Bubble Diagram to PowerPoint Presentation

Bubble diagrams can be used to compare concepts, and identify areas of similarity and difference. ConceptDraw PRO allows you to make a MS PowerPoint Presentation from your charts in a few simple steps. A bubble diagram is a chart that represents information visually in the form of series of bubbles. Bubble charts are often used in marketing and management during the early stages of product development to visualize ideas and concepts by organizing them in a hierarchy. The ability to create this form of diagram is contained within the Bubble Diagrams solution. A PowerPoint presentation of bubble diagrams can be used to demonstrate and identify areas of similarity and difference of featured business ideas and concepts.
HelpDesk

How To Create Visio Bubble Chart

ConceptDraw PRO allows you to easily create business charts and diagrams of any complexity, including the bubbles diagram and then make a MS Visio file from your diagram in a few simple steps.
HelpDesk

How To Convert a Bubble Diagram to Adobe PDF

ConceptDraw PRO allows you to easy share your business documentation between different computers with different operating systems and applications using it's export capabilities. You can get your bubble diagrams in pdf format and freely communicate them with others.

Bubble diagrams with ConceptDraw PRO

Using ConceptDraw you will be able to create bubble diagrams from the ready ConceptDraw library objects or make your own objects. The created diagram can be saved and edited, objects can be moved and links between them will be automatically repainted after object moving because of using the ConceptDraw connectors.

Simple Diagramming

Create flowcharts, org charts, floor plans, business diagrams and more with ConceptDraw PRO.

Building Drawing Software for Design Office Layout Plan

Building Drawing simple office layout plans easily with ConceptDraw PRO.
Use they to develop the floor plans, and blueprints for facilities management, move management, office supply inventories, assets inventories, office layout plan.
How to Draw a Floor Plan
HelpDesk

How to Create Cisco Network Diagrams

The easiest way to design Cisco Network diagram using standard Cisco product symbols is using ConceptDraw PRO powered by Cisco Network Diagrams solution.
The Cisco Network Diagrams solution uses Cisco network symbols to to visually document the topology and design of Cisco networks.
HelpDesk

How To Make Visio Circle-Spoke Diagram

Circle Spoke Diagram consists from a central round balloon , wich is circled with other balloons as a ring . The Circle Spoke Diagram is usually used in marketing . It shows the relationships of entities and the central element. Circle Spoke Diagram can be used in marketing documentation and presentations. ConceptDraw PRO allows you to easily create marketing charts of any complexity, including the circle-spoke diagram and then make a MS Visio file from your diagram in a few simple steps. You can easily design your business documentation and share it easily with MS Visio users.

workflow diagram software, workflow patterns Workflow Diagrams

workflow diagram software, workflow patterns
Workflow Diagrams solution extends ConceptDraw PRO software with samples, templates and vector stencils library for drawing the work process flowcharts.
HelpDesk

How to Create a Timeline Diagram in ConceptDraw PRO

A Timeline is a chart which displays a project plan schedule in chronological order. A Timeline is used in project management to depict project milestones and visualize project phases, and show project progress. The graphic form of a timeline makes it easy to understand critical project milestones, such as the progress of a project schedule. Timelines are particularly useful for project scheduling or project management when accompanied with a Gantt chart. It captures the main of what the project will accomplish and how it will be done. making a project timeline is one of the most important skills a project manager needs have. Making comprehensive, accurate timelines allows you getting every project off in the best way. ConceptDraw PRO allows you to draw a timeline charts using special library.
HelpDesk

How To Convert a Circle-Spoke Diagram to Adobe PDF

ConceptDraw PRO allows you to easy share your marketing documentation between different computers with different operating systems and applications using it's export capabilities. You can get your marketing diagrams in pdf format and avoid any problems while communicating them.
HelpDesk

How To Create MS Visio Cross-Functional Flowchart

Cross-functional is a process involving several functional layers. Such processes typically cause the most problems, and therefore, is the most potential for improvement. Cross-functional business processes are usually illustrate the processes of product development, commercial proposal development, the order execution process - everything, that involves several departments. The package of possible improvements - is the task of re-engineering. To illustrate the cross-functional processes often use cross-functional flowchart is often used to illustrate the cross-functional processes. ConceptDraw PRO allows you to easily create cross-functional flowchart. Then, you can export it to MS Visio VSDX or VDX format and successfully share it with your colleagues still using MS Visio.

Block Diagram

The vector stencils libraries: Block Diagrams, Blocks with Perspective, Callouts, Connectors, Raised Blocks from the solution Block Diagrams contain specific block diagram symbols such as arrows, input/output symbols, start/end symbols, processing symbols, conditional symbols, commenting symbols, callouts, connectors, etc. for ConceptDraw PRO diagramming and vector drawing software. The Block Diagrams solution is contained in a "Diagrams" area of ConceptDraw Solution Park.
Use the libraries from the Block Diagrams solution to draw block diagrams for your business documents, presentations and websites in a few minutes.
HelpDesk

How to Add a Circle-Spoke Diagram to MS Word Document

ConceptDraw PRO allows you to easily create various marketing charts, including the circle-spoke diagrams and then insert them into a MS Word document.
HelpDesk

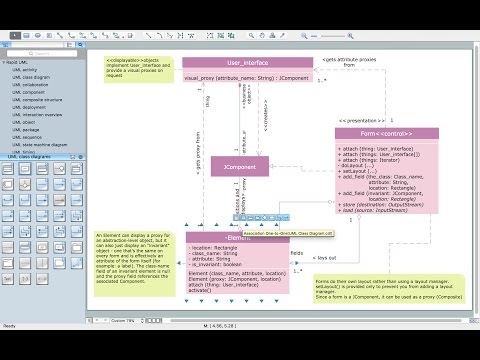
How to Create a UML Diagram Using ConceptDraw PRO

ConceptDraw PRO is a perfect tool to draw UML Diagrams.
Rapid UML Solution
Rapid UML Solution
HelpDesk

How To Create a MS Visio Business Process Diagram

Business process diagrams are specialized types of flowcharts based on the Business Process Model and Notation. The BPMN specification describes the symbols to display business processes in the form of business process diagrams. The main objective of BPMN is to create a standard set of symbols that are understandable to all business users, such as business analysts who create and improve processes, technical developers responsible for implementing processes and managers who take care processes and control them. Making a business process diagram involves many different elements that can be managed using ConceptDraw PRO. The ability to design Business process diagrams is delivered by the Business Process Diagrams solution. ConceptDraw PRO supports export of business process diagrams to MS Visio files. Thus, you can share your business documentation with MS Visio users.

Building Drawing Software for Design Registers, Drills and Diffusers

Use the appropriate stencils from Registers, Drills and Diffusers library for create building plans.