Flowchart design. Flowchart symbols, shapes, stencils and icons


Pyramid Diagram

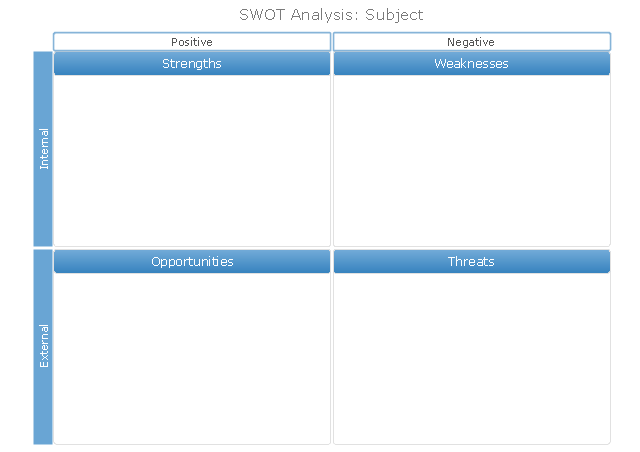
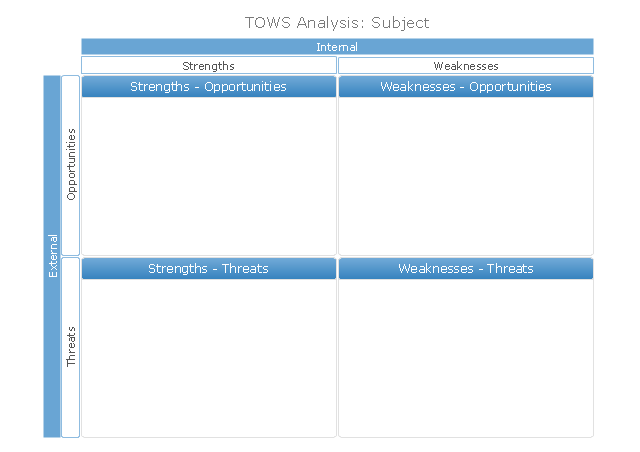
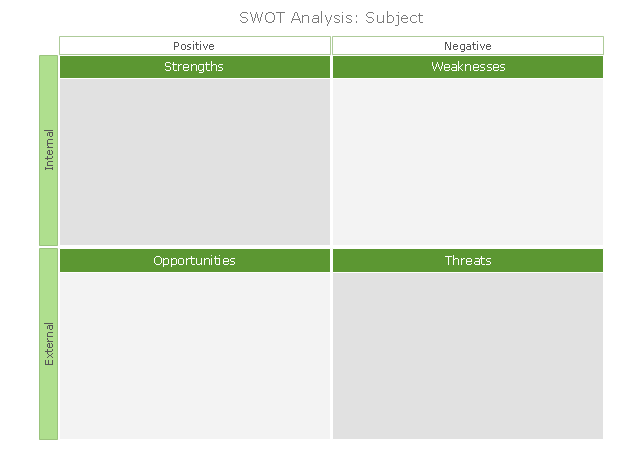
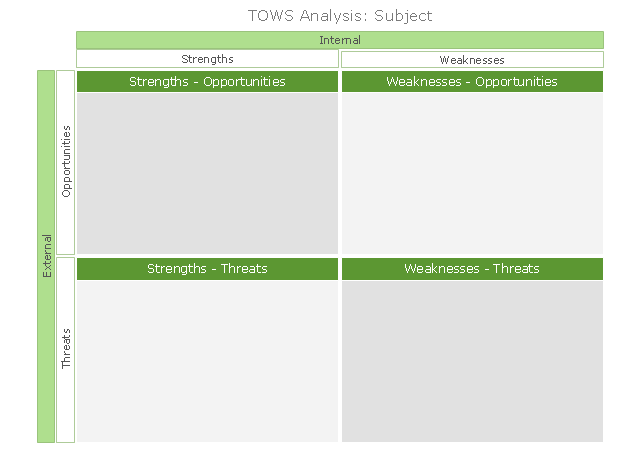
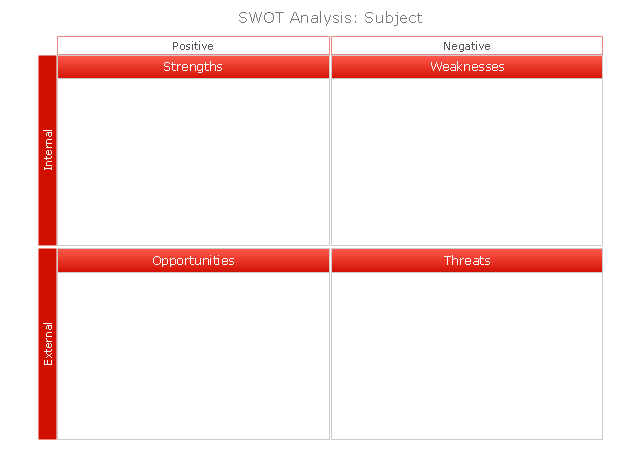
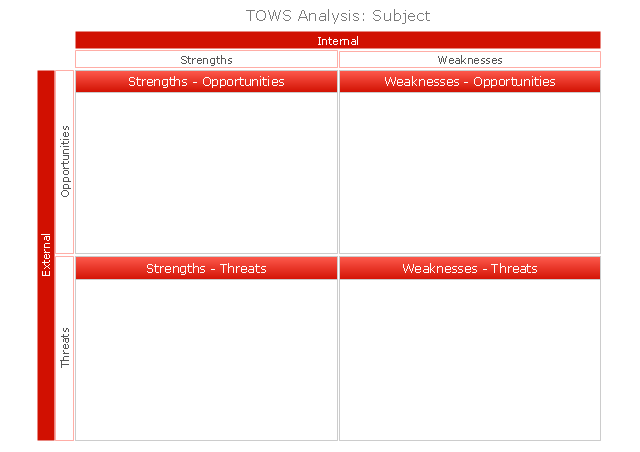
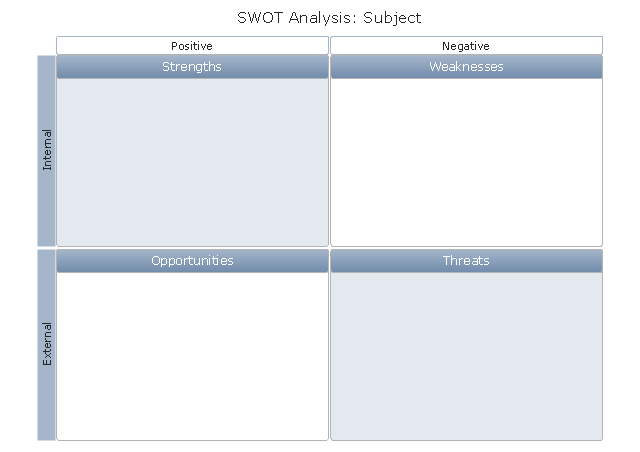
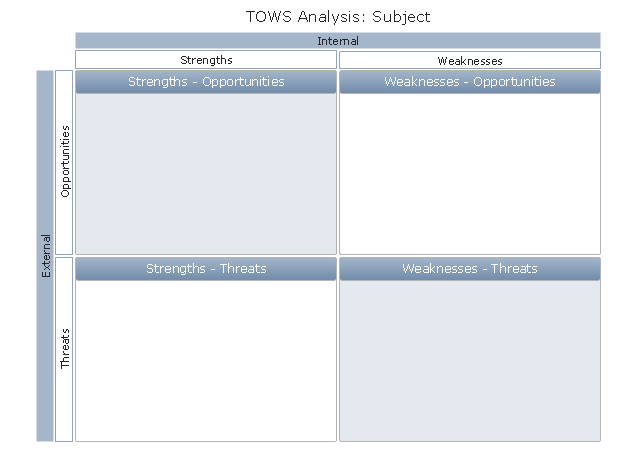
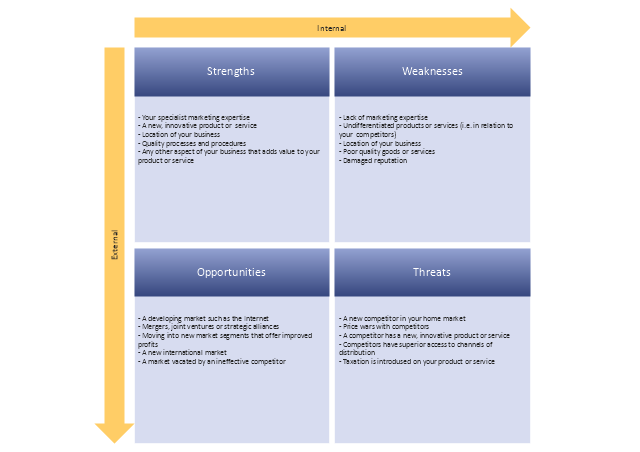
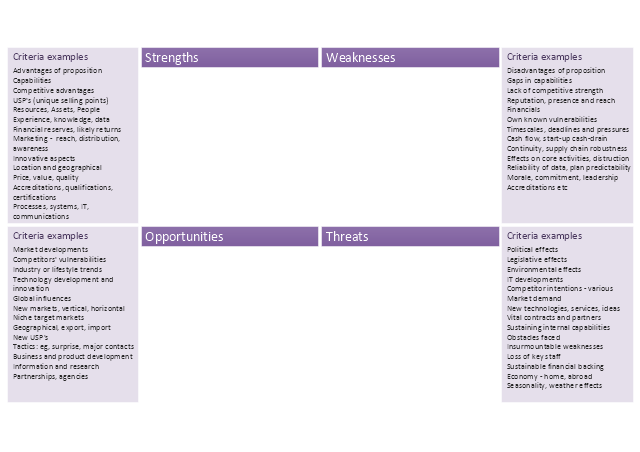
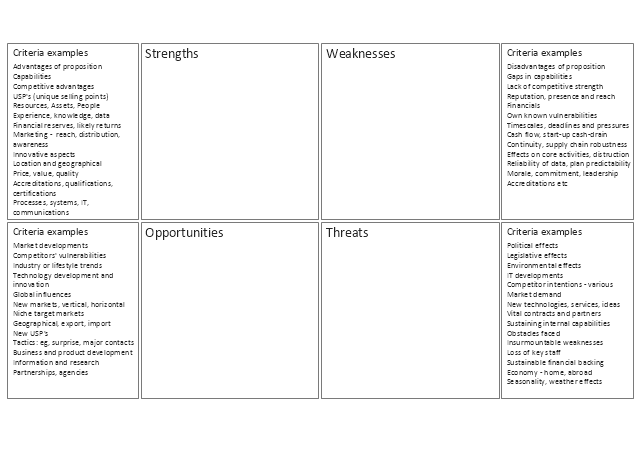
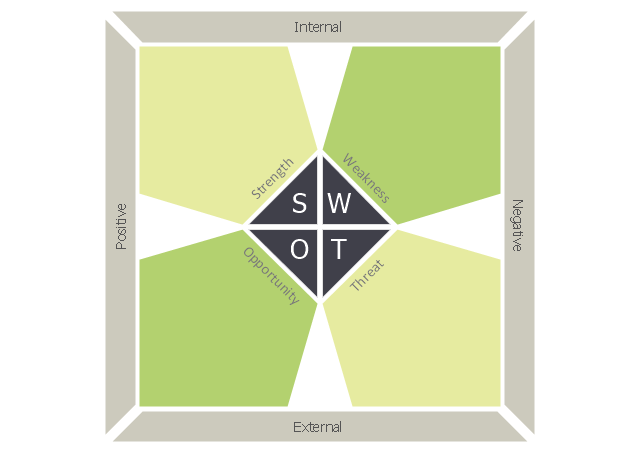
The vector stencils library "SWOT" contains 19 SWOT and TOWS analysis matrix diagram templates. Use it to create your SWOT and TOWS matrices in the ConceptDraw PRO diagramming and vector drawing software extended with the SWOT Analysis solution from the Management area of ConceptDraw Solution Park.
SWOT Matrix
TOWS Matrix
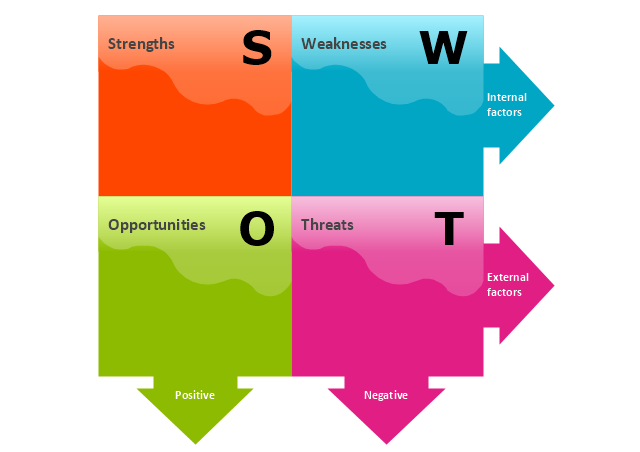
SWOT Matrix, green
TOWS Matrix, green
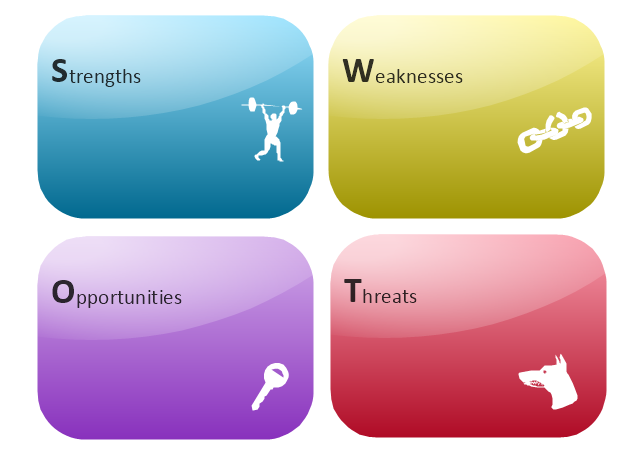
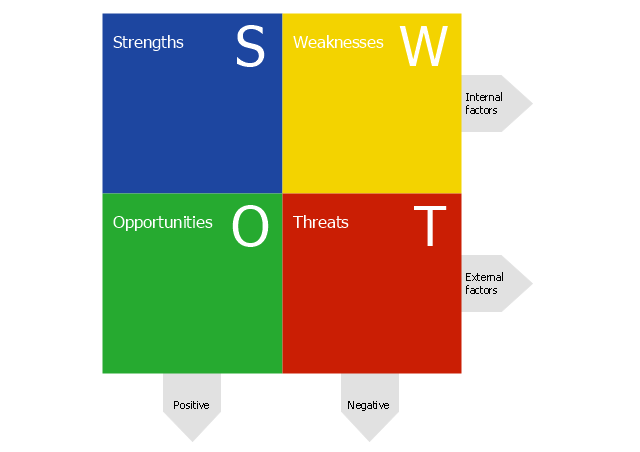
SWOT Matrix, red
TOWS Matrix, red
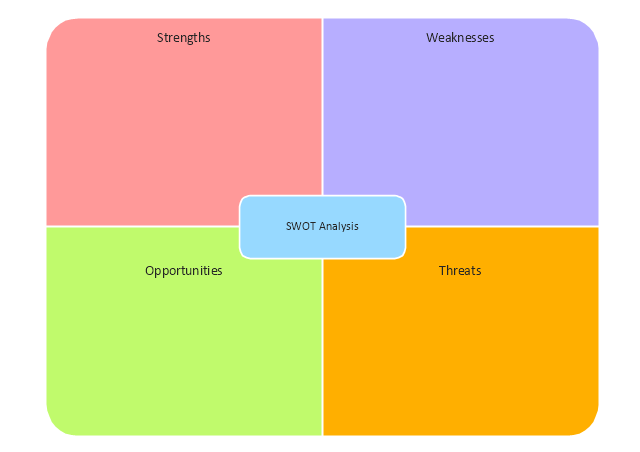
SWOT Matrix, soft
TOWS Matrix, soft
SWOT
SWOT Matrix
SWOT Matrix
SWOT Matrix
SWOT Analysis Matrix
SWOT Analysis Matrix - black and white
Pentagons SWOT matrix
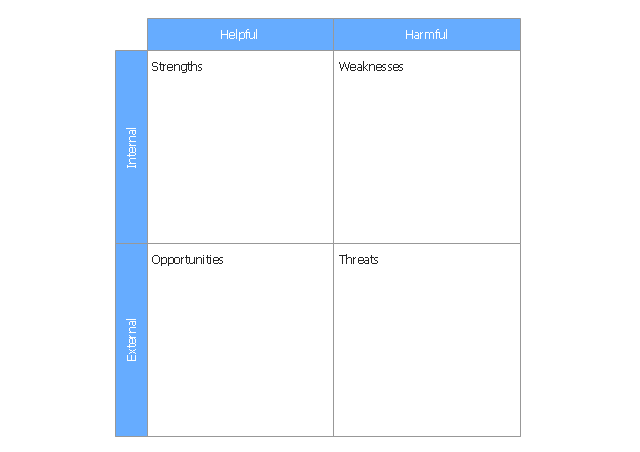
SWOT analysis template
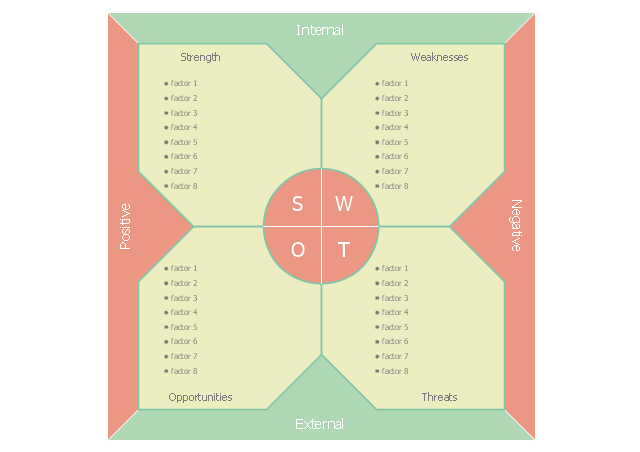
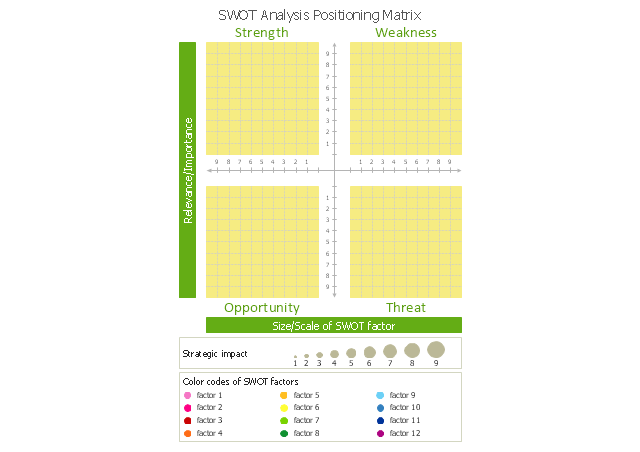
SWOT analysis positioning matrix
SWOT matrix
SWOT analysis
Process Flowchart


Data Flow Diagram

Geo Map - Europe - Bulgaria

Flowchart design. Flowchart symbols, shapes, stencils and icons
Geo Map - Australia

Geo Map - Asia - Japan

 Chess
Chess
Chess solution extends ConceptDraw PRO v11 application with samples, special templates and libraries of 2D and 3D elements of chessboards and chess pieces to help display any events on the chessboard, to illustrate the winning positions and chess combinations, to analyze the famous games played by prominent chess masters, to simulate gambits, to teach the audience to play chess and to demonstrate visually the chess rules, to show the variations of moves and ways of setting the checkmate to opponent in a fewest number of steps. Special template ConceptDraw PRO allows to play chess on a local network.
SWOT Matrix Software

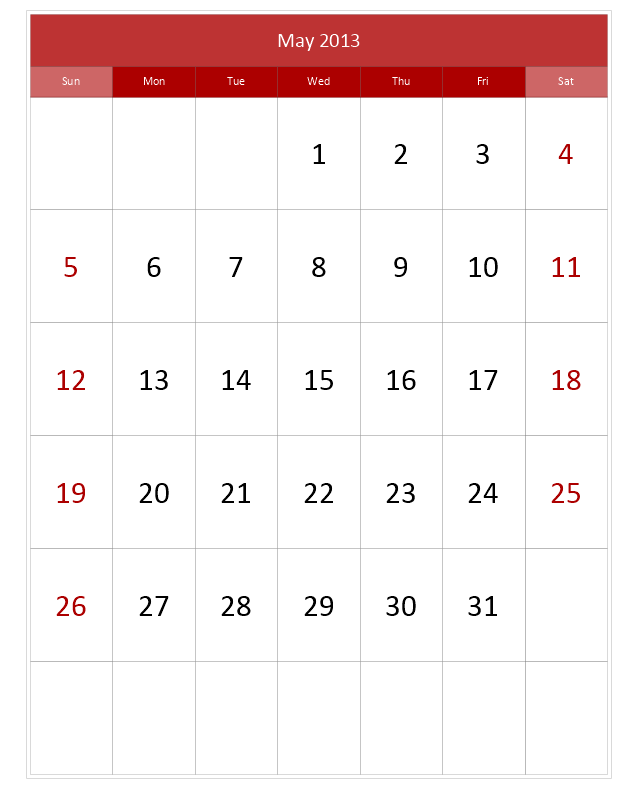
The vector stencils library "Calendars" contains 44 shapes of month calendars, marker icons and symbols for schedules, and clocks. Use it to create your calendars in the ConceptDraw PRO diagramming and vector drawing software extended with the Calendars solution from the Management area of ConceptDraw Solution Park.
Small Calendar (White, Rounded)
-calendars---vector-stencils-library.png--diagram-flowchart-example.png)
Small Calendar (White)
-calendars---vector-stencils-library.png--diagram-flowchart-example.png)
Small Calendar (Black, Rounded)
-calendars---vector-stencils-library.png--diagram-flowchart-example.png)
Small Calendar (Black)
-calendars---vector-stencils-library.png--diagram-flowchart-example.png)
Small Calendar (Color, Rounded)
-calendars---vector-stencils-library.png--diagram-flowchart-example.png)
Small Calendar (Color)
-calendars---vector-stencils-library.png--diagram-flowchart-example.png)
Mid Calendar (Rounded)
-calendars---vector-stencils-library.png--diagram-flowchart-example.png)
Mid Calendar
Large Calendar (Picture 1)
-calendars---vector-stencils-library.png--diagram-flowchart-example.png)
Large Calendar (Picture 2)
-calendars---vector-stencils-library.png--diagram-flowchart-example.png)
Large Calendar (Color)
-calendars---vector-stencils-library.png--diagram-flowchart-example.png)
Large Calendar
Large Calendar (Rounded)
-calendars---vector-stencils-library.png--diagram-flowchart-example.png)
Stylish Clocks
Clocks

Clocks
Week (First Letters)
-calendars---vector-stencils-library.png--diagram-flowchart-example.png)
Week
7 days
7 days
Month
Weeks
Quarter
3 Month
Special Day (Circle)
-calendars---vector-stencils-library.png--diagram-flowchart-example.png)
Special Day (Square)
-calendars---vector-stencils-library.png--diagram-flowchart-example.png)
Special Day (Triangle)
-calendars---vector-stencils-library.png--diagram-flowchart-example.png)
Special Day (Star)
-calendars---vector-stencils-library.png--diagram-flowchart-example.png)
Special Day (Cross)
-calendars---vector-stencils-library.png--diagram-flowchart-example.png)
Special Day (Check)
-calendars---vector-stencils-library.png--diagram-flowchart-example.png)
Special Day (Clocks)
-calendars---vector-stencils-library.png--diagram-flowchart-example.png)
Special Day (Note)
-calendars---vector-stencils-library.png--diagram-flowchart-example.png)
Special Day (Lightning)
-calendars---vector-stencils-library.png--diagram-flowchart-example.png)
Special Day (Heart)
-calendars---vector-stencils-library.png--diagram-flowchart-example.png)
:)
-calendars---vector-stencils-library.png--diagram-flowchart-example.png)
:(

Moon phase, new
Moon phase, waxing crescent
Moon phase, 1st quarter
Moon phase, waxing gibbous

Moon phase, full
Moon phase, waning gibbous
Moon phase, 3rd quarter
Moon phase, waning crescent
Bubble diagrams with ConceptDraw PRO

- Vertical White Line Transparent Png
- Stethoscope Png White Line
- White Line Vertical Png
- White Bar Line Png
- Black Line Png
- Process Line Png
- Straight Black Line Png
- Horizontal White Line Png
- Exit Png White
- Round Lines Black And White
- Chevron Down Png Transparent Background
- Line Diagram Png
- Black Vertical Line Png
- Vector Ribbons Single Side White Png
- Transparent Background Vertical Scroll Bar
- White Black Line Background
- White Vertical Line
- ConceptDraw Solution Park | Black Transparent Bar Png
- Line Black Vertical Png
- Cross White Png