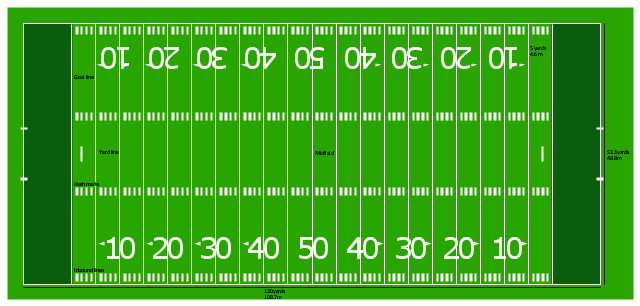
"Football games are played on a rectangular field that measures 120 yards (110 m) long and 53.33 yards (48.76 m) wide. Lines marked along the ends and sides of the field are known respectively as the end lines and side lines, and goal lines are marked 9 yards (8.2 m) outward from each end line. Weighted pylons are placed on the inside corner of the intersections of the goal lines and end lines.
White markings on the field identify the distance from the end zone. Inbound lines, or hash marks, are short parallel lines that mark off 1 yard (0.91 m) increments. Yard lines, which run the width of the field, are marked every 5 yards (4.6 m). A line one yard wide is placed at each end of the field. This line is marked at the center of the two-yard line in professional play and at the three-yard line in college play. Numerals that display the yard lines in multiples of ten are placed along both sides of the field.
Goalposts are at the center of the plane of each of the two end lines. The crossbar of these posts is ten feet (3 meters) above the ground, with vertical uprights at the end of the crossbar 18 feet 6 inches (6 m) apart for professional and collegiate play and 23 feet 4 inches (7 m) apart for high school play. The uprights extend vertically 10 yards on professional fields, a minimum of 10 yards on college fields, and a minimum of ten feet on high school fields. Goal posts are padded at the base, and orange ribbons are normally placed at the tip of each upright." [American football. Wikipedia]
The diagram example "Horizontal colored football field" was created using the ConceptDraw PRO diagramming and vector drawing software extended with the Football solution from the Sport area of ConceptDraw Solution Park.
American football field diagram
Process Flowchart


Basic Flowchart Symbols and Meaning


Chart Examples

"A football pitch (also known as a football field or soccer field) is the playing surface for the game of football made of turf. Its dimensions and markings are defined by Law 1 of the Laws of the Game, "The Field of Play".
All line markings on the pitch form part of the area which they define. ...
Pitch boundary.
The pitch is rectangular in shape. The longer sides are called touchlines. The other opposing sides are called the goal lines. ... The two touch lines must also be of the same length... in international matches, the goal lines must be between 64 and 75 m (70 and 80 yd) long and the touchlines must be between 100 and 110 m (110 and 120 yd). All lines must be equally wide, not to exceed 12 centimetres (5 in). The corners of the pitch are demarcated by corner flags. ...
Goals.
Goals are placed at the centre of each goal-line. These consist of two upright posts placed equidistant from the corner flagposts, joined at the top by a horizontal crossbar. The inner edges of the posts must be 7.32 metres (8 yd) apart, and the lower edge of the crossbar must be 2.44 metres (8 ft) above the ground. Nets are usually placed behind the goal, though are not required by the Laws.
Goalposts and crossbars must be white, and made of wood, metal or other approved material." [Association football pitch. Wikipedia]
The diagram example "Association football (soccer) field dimensions" was created using the ConceptDraw PRO diagramming and vector drawing software extended with the Football solution from the Sport area of ConceptDraw Solution Park.
www.conceptdraw.com/ solution-park/ sport-soccer
Association football (soccer) diagram
-diagram-association-football-(soccer)-field-dimensions.png--diagram-flowchart-example.png)
How to Create a Scatter Chart

Chart Templates

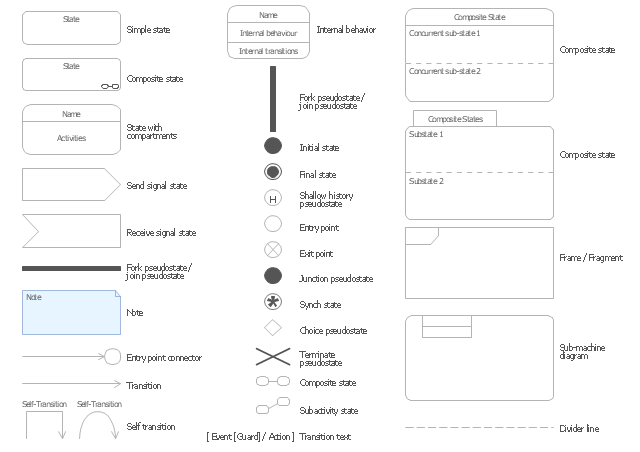
The vector stencils library "UML state machine diagrams" contains 35 symbols for the ConceptDraw PRO diagramming and vector drawing software.
"The state diagram in the Unified Modeling Language is essentially a Harel statechart with standardized notation, which can describe many systems, from computer programs to business processes. In UML 2 the name has been changed to State Machine Diagram. The following are the basic notational elements that can be used to make up a diagram:
(1) Filled circle, pointing to the initial state.
(2) Hollow circle containing a smaller filled circle, indicating the final state (if any).
(3) Rounded rectangle, denoting a state. Top of the rectangle contains a name of the state. Can contain a horizontal line in the middle, below which the activities that are done in that state are indicated.
(4) Arrow, denoting transition. The name of the event (if any) causing this transition labels the arrow body. A guard expression may be added before a "/ " and enclosed in square-brackets ( eventName[guardExpression] ), denoting that this expression must be true for the transition to take place. If an action is performed during this transition, it is added to the label following a "/ " ( eventName[guardExpression]/ action ).
(5) Thick horizontal line with either x>1 lines entering and 1 line leaving or 1 line entering and x>1 lines leaving. These denote join/ fork, respectively." [State diagram (UML). Wikipedia]
The example "Design elements - UML state machine diagrams" is included in the Rapid UML solution from the Software Development area of ConceptDraw Solution Park.
UML state machine diagram symbols
Create Organizational Chart

How To Create CCTV Network Diagram

Security Plans

Cross-Functional Flowchart


The vector stencils library "Sales dashboard" contains 27 charts and graphic indicators.
Use it for drawing sales dashboards in the ConceptDraw PRO diagramming and vector drawing software extended with the Sales Dashboard solution from the Marketing area of ConceptDraw Solution Park.
Use it for drawing sales dashboards in the ConceptDraw PRO diagramming and vector drawing software extended with the Sales Dashboard solution from the Marketing area of ConceptDraw Solution Park.
Column Chart

Bar Chart

Line Chart

Divided Bar

Pie Chart

Two Bubbles Indicator

Speedometer Gauge 1

Speedometer Gauge 2

Speedometer Gauge 3

Speedometer Gauge 4

Slider Horizontal 1

Slider Horizontal 2

Slider Horizontal 3

Slider Horizontal 4

Slider Horizontal 5

Slider Horizontal 6

Slider Horizontal 7

Slider Vertical 1

Slider Vertical 2

Slider Vertical 3

Bullet 1

Bullet 2

Bullet 3

Bullet 4

Backgroung 1

Backgroung 2

Backgroung 3

The vector stencils library "Mac OS X Lion user interface" contains 52 UI design elements.
Use it for designing Mac OS X Lion graphic user interface (GUI) of software for Apple computers in the ConceptDraw PRO diagramming and vector drawing software extended with the Graphic User Interface solution from the Software Development area of ConceptDraw Solution Park.
Use it for designing Mac OS X Lion graphic user interface (GUI) of software for Apple computers in the ConceptDraw PRO diagramming and vector drawing software extended with the Graphic User Interface solution from the Software Development area of ConceptDraw Solution Park.
Title Bar

Title Bar Inactive

Window

Window Inactive

Window Title Bar

Window Title Bar (Inactive)
-mac-os-x-lion-user-interface---vector-stencils-library.png--diagram-flowchart-example.png)
Full Screen Button

Exit Full Screen Button

Window without Bar

Window (Narrow Toolbar)
-mac-os-x-lion-user-interface---vector-stencils-library.png--diagram-flowchart-example.png)
Window Inactive (Narrow Toolbar)
-mac-os-x-lion-user-interface---vector-stencils-library.png--diagram-flowchart-example.png)
Panel (Hud Window)
-mac-os-x-lion-user-interface---vector-stencils-library.png--diagram-flowchart-example.png)
Panel (Hud Window) (Inactive)
-(inactive)-mac-os-x-lion-user-interface---vector-stencils-library.png--diagram-flowchart-example.png)
Box 1

Box 2

Field
List View 1

List View 2

Scroll Bar Vertical

Scroll Bar Horizontal

Main Menu
Menu Bar

Menu

Vertical Line

Horizontal Line

Apple Menu

Arrow mark
Combo Box

Pop Up Menu

Text Field

Count Button

Search Field

Check Box

Check Box

Group of Check Boxes

Radio Button

Radio Button

Group of Radio Buttons

Linear Slider (round thumb)
-mac-os-x-lion-user-interface---vector-stencils-library.png--diagram-flowchart-example.png)
Linear Slider (directional thumb)
-mac-os-x-lion-user-interface---vector-stencils-library.png--diagram-flowchart-example.png)
Circular Slider

Color Well

Relevance Indicator

Rating Indicator

Indeterminate Progress Bar

Determinate Progress Bar

Continuous Capacity Indicator

Discrete Capacity Indicator

Discrete Capacity Indicator (yellow)
-mac-os-x-lion-user-interface---vector-stencils-library.png--diagram-flowchart-example.png)
Discrete Capacity Indicator (red)
-mac-os-x-lion-user-interface---vector-stencils-library.png--diagram-flowchart-example.png)
Asynchronous Progress Indicator

Circular Progress Indicator

Cross Functional Flowchart Symbols

- Vertical White Line Transparent Png
- Football Field Png
- Vertical association football pitch - Template | Sport Field Plans ...
- Football Pitch Png
- Arrow Png White
- Footbal Pitch Png
- Labels Lines Png
- White Arrow Png
- Goal Line Formation (Offense/Defense) Diagram | Association ...
- Speedometer Png
- Playing Soccer Png Image Full Black
- Goal Png
- Rectangular Ribbon Png
- Soccer Field Png
- Vertical Line Chart
- Basic Line Graphs | Menus - Vector stencils library | Vertical Cross ...
- Curved Arrow Icon Png
- Football Fans Png
- Standard Football Field Dimension Black And White
- Players Black And White Diagrams To Draw