Samples of Flowchart

 Electrical Engineering
This solution extends ConceptDraw DIAGRAM.9.5 (or later) with electrical engineering samples, electrical schematic symbols, electrical diagram symbols, templates and libraries of design elements, to help you design electrical schematics, digital and analog
Types of Flowcharts


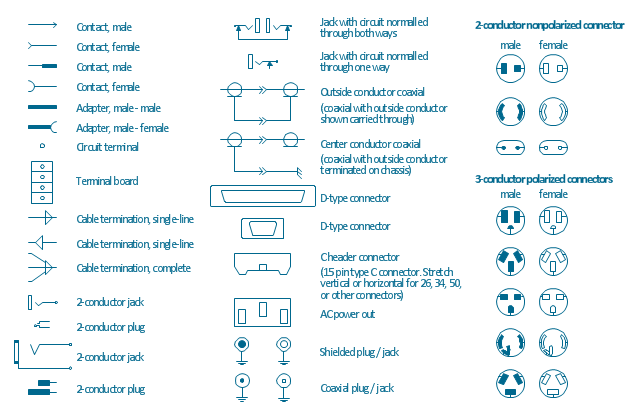
The vector stencils library "Terminals and connectors" contains 43 element symbols of terminals, connectors, plugs, polarized connectors, jacks, coaxial cables, and conductors.
Use it for drawing the wiring diagrams, electrical layouts, electronic schematics, and circuit diagrams.
"An electrical connector is an electro-mechanical device for joining electrical circuits as an interface using a mechanical assembly. Connectors consist of plugs (male-ended) and jacks (female-ended). The connection may be temporary, as for portable equipment, require a tool for assembly and removal, or serve as a permanent electrical joint between two wires or devices. An adapter can be used to effectively bring together dissimilar connectors.
There are hundreds of types of electrical connectors. Connectors may join two lengths of flexible copper wire or cable, or connect a wire or cable or optical interface to an electrical terminal.
In computing, an electrical connector can also be known as a physical interface... Cable glands, known as cable connectors in the US, connect wires to devices mechanically rather than electrically and are distinct from quick-disconnects performing the latter." [Electrical connector. Wikipedia]
"A terminal is the point at which a conductor from an electrical component, device or network comes to an end and provides a point of connection to external circuits. A terminal may simply be the end of a wire or it may be fitted with a connector or fastener. In network analysis, terminal means a point at which connections can be made to a network in theory and does not necessarily refer to any real physical object. In this context, especially in older documents, it is sometimes called a "pole".
The connection may be temporary, as seen in portable equipment, may require a tool for assembly and removal, or may be a permanent electrical joint between two wires or devices.
All electric cell have two terminals. The first is the positive terminal and the second is the negative terminal. The positive terminal looks like a metal cap and the negative terminal looks like a metal disc. The current flows from the positive terminal, and out through the negative terminal, replicative of current flow (positive (+) to negative (-) flow)." [Terminal (electronics). Wikipedia]
The shapes example "Design elements - Terminals and connectors" was drawn using the ConceptDraw PRO diagramming and vector drawing software extended with the Electrical Engineering solution from the Engineering area of ConceptDraw Solution Park.
Terminal and connector symbols
Create Floor Plans Easily with ConceptDraw DIAGRAM


 Physics
Physics solution extends ConceptDraw DIAGRAM software with templates, samples and libraries of vector stencils for drawing the physical illustrations, diagrams and charts.
Electrical Diagram Software


 Stakeholder Onion Diagrams
The Stakeholder Onion Diagram is often used as a way to view the relationships of stakeholders to a project goal. A basic Onion Diagram contains a rich information. It shows significance of stakeholders that will have has influence to the success achieve
 Workflow Diagrams
Workflow Diagrams solution extends ConceptDraw DIAGRAM software with samples, templates and vector stencils library for drawing the work process flowcharts.
What Is Information Architecture

 Sales Flowcharts
The Sales Flowcharts solution lets you create and display sales process maps, sales process workflows, sales steps, the sales process, and anything else involving sales process management.
 Seven Management and Planning Tools
Seven Management and Planning Tools solution extends ConceptDraw DIAGRAM and ConceptDraw MINDMAP with features, templates, samples and libraries of vector stencils for drawing management mind maps and diagrams.
 25 Typical Orgcharts
The 25 Typical Orgcharts solution contains powerful organizational structure and organizational management drawing tools, a variety of professionally designed organization chart and matrix organization structure samples, 25 templates based on various orga
 Rack Diagrams
The Rack Diagrams solution, including a vector stencil library, a collection of samples and a quick-start template, can be useful for all who deal with computer networks. Choosing any of the 54 library's vector shapes, you can design various types of Rack diagrams or Server rack diagrams visualizing 19" rack mounted computers and servers.
Functional Block Diagram

Landscape Plan

 Business Diagrams
The Business Diagrams Solution extends ConceptDraw DIAGRAM with an extensive collection of professionally designed illustrative samples and a wide variety of vector stencils libraries, which are the real help for all business-related people, business analysts, business managers, business advisers, marketing experts, PR managers, knowledge workers, scientists, and other stakeholders allowing them to design the bright, neat, expressive and attractive Bubble Diagrams, Circle-Spoke Diagrams, Circular Arrows Diagrams, and Venn Diagrams with different quantity of sets in just minutes; and then successfully use them in documents, reports, statistical summaries, and presentations of any style.
Activity on Node Network Diagramming Tool

Circular Diagram

 Business Process Mapping
The Business Process Mapping solution for ConceptDraw DIAGRAM is for users involved in process mapping and creating SIPOC diagrams.
- House Wiring Pdf In Hindi
- Shopping Mall Wire Arrangement A Electric Engineer Pdf
- Basic Electrical Books In Tamil Pdf
- Plan Of A School For Wireing Pdf
- How To use House Electrical Plan Software | CCTV Surveillance ...
- Pdf Wiring Diagram Of Cctv
- Venn Diagrams | Downliad Pdf
- Pdf All Electrical Symbols
- How To use House Electrical Plan Software | Home Electrical Plan ...
- Mechanical Drawing Symbols | Home Electrical Plan | Electrical ...
- Hostel Wiring Theory
- How To use Electrical and Telecom Plan Software | Home Electrical ...
- Commercial Building Floor Plan Pdf
- Process Flowchart | Basic Diagramming | Mechanical Drawing ...
- Mall Electrical Circuit Design
- Circuit Diagram Of Cctv Camera Connection
- Fishbone Diagram | How To Convert a Fishbone Diagram to Adobe ...
- Flow Chart Of Cctv Camera Pdf
- Cctv Business Plan Pdf
- Building Drawing Software for Design Office Layout Plan | How To ...