Bar Diagram Math

Bar Diagrams for Problem Solving. Create economics and financial bar charts with Bar Graphs Solution

 Divided Bar Diagrams
The Divided Bar Diagrams Solution extends the capabilities of ConceptDraw DIAGRAM with templates, samples, and a library of vector stencils for drawing high impact and professional Divided Bar Diagrams and Graphs, Bar Diagram Math, and Stacked Graph.
Use this chart template to design your divided bar diagrams.
A divided bar chart is a rectangle divided into segments, illustrating numerical proportion. In a divided bar chart, the length of each segment (and consequently its area), is proportional to the quantity it represents.
This divided bar graph displays the number of people per day who visited swimming pool.
The template "Divided bar diagram" for the ConceptDraw PRO diagramming and vector drawing software is included in the Divided Bar Diagrams solution from the Graphs and Charts area of ConceptDraw Solution Park.
Template
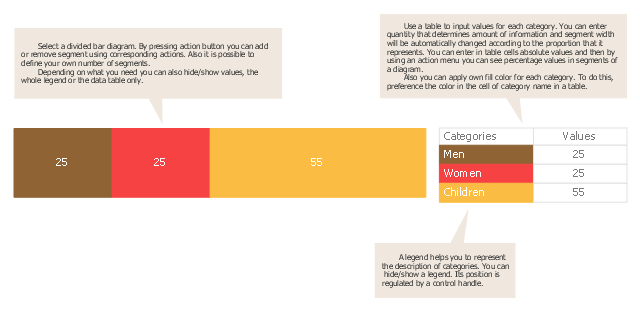
The vector stencils library "Divided bar diagrams" contains 12 templates of divided bar diagrams for visualizing percent composition of one total consists of few components.
Drag the template from the library to your document and enter your data.
Use these shapes to draw your divided bar diagrams in the ConceptDraw PRO diagramming and vector drawing software.
The vector stencils library "Divided bar diagrams" is included in the Divided Bar Diagrams solution from the Graphs and Charts area of ConceptDraw Solution Park.
Divided bar diagram (orange)
-divided-bar-diagrams---vector-stencils-library.png--diagram-flowchart-example.png)
Divided bar diagram (orange) 2
-2-divided-bar-diagrams---vector-stencils-library.png--diagram-flowchart-example.png)
Divided bar diagram (blue)
-divided-bar-diagrams---vector-stencils-library.png--diagram-flowchart-example.png)
Divided bar diagram (blue) 2
-2-divided-bar-diagrams---vector-stencils-library.png--diagram-flowchart-example.png)
Divided bar diagram (green)
-divided-bar-diagrams---vector-stencils-library.png--diagram-flowchart-example.png)
Divided bar diagram (green) 2
-2-divided-bar-diagrams---vector-stencils-library.png--diagram-flowchart-example.png)
Divided bar diagram (aquamarine)
-divided-bar-diagrams---vector-stencils-library.png--diagram-flowchart-example.png)
Divided bar diagram (aquamarine) 2
-2-divided-bar-diagrams---vector-stencils-library.png--diagram-flowchart-example.png)
Divided bar diagram (gray)
-divided-bar-diagrams---vector-stencils-library.png--diagram-flowchart-example.png)
Divided bar diagram (gray) 2
-2-divided-bar-diagrams---vector-stencils-library.png--diagram-flowchart-example.png)
Divided bar diagram (table)
-divided-bar-diagrams---vector-stencils-library.png--diagram-flowchart-example.png)
Divided bar diagram (table) 2
-2-divided-bar-diagrams---vector-stencils-library.png--diagram-flowchart-example.png)
Bar Diagrams for Problem Solving. Create business management bar charts with Bar Graphs Solution

Bar Diagrams for Problem Solving. Create manufacturing and economics bar charts with Bar Graphs Solution

Identifying Quality Management System

Venn Diagram Examples for Problem Solving. Environmental Social Science. Human Sustainability Confluence

Bar Diagrams for Problem Solving. Create event management bar charts with Bar Graphs Solution

Bar Chart Template for Word

Chart Maker for Presentations

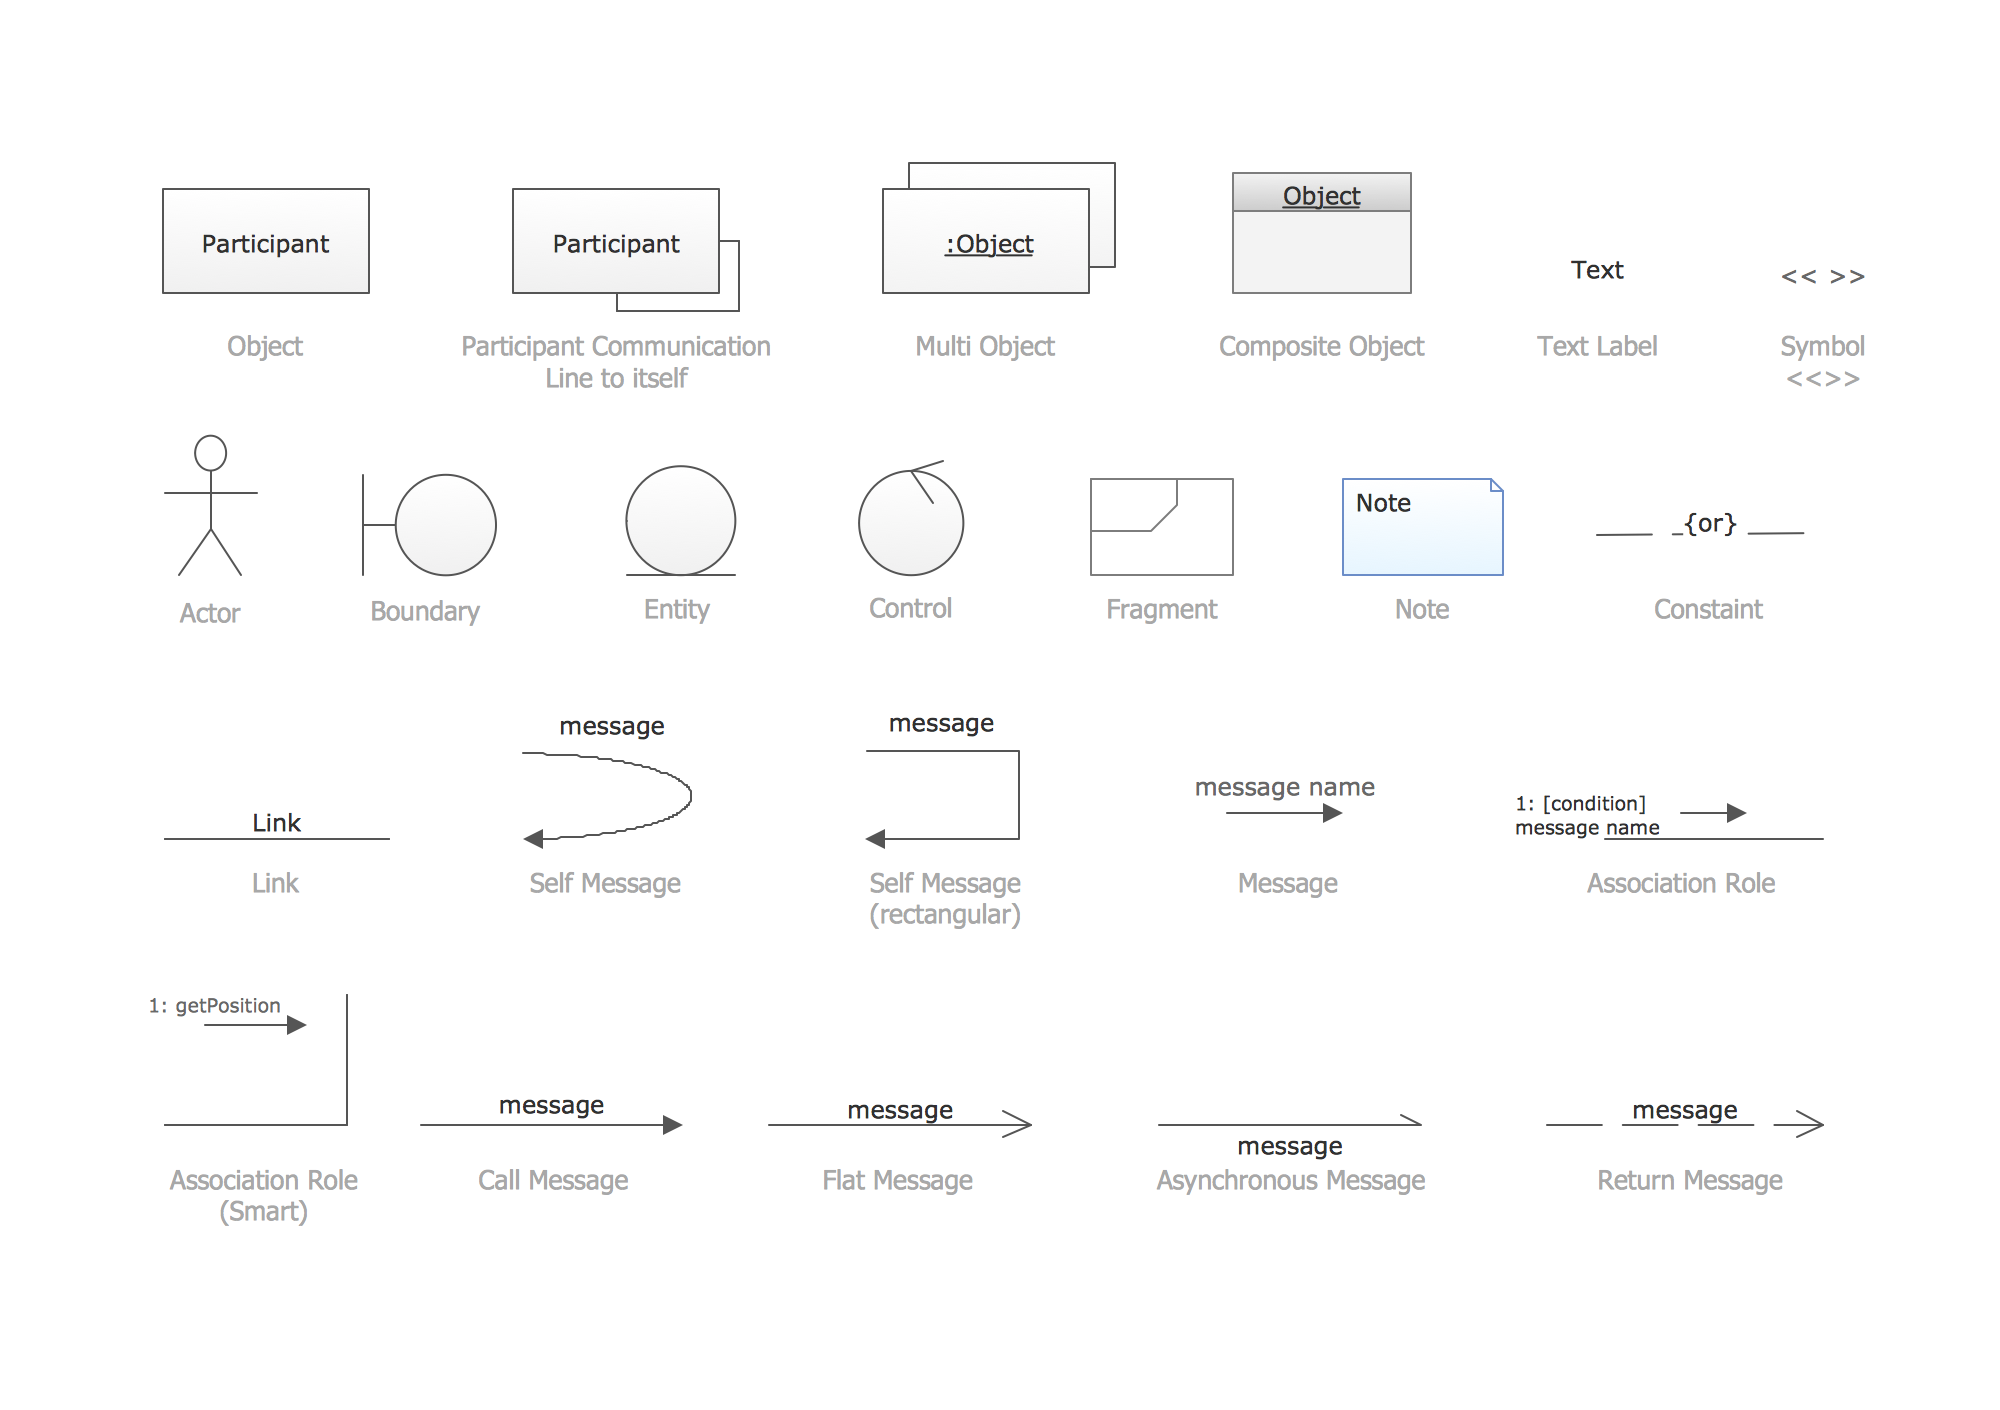
UML Collaboration Diagram. Design Elements
Entity Relationship Diagram - ERD - Software for Design Crows Foot ER Diagrams
_Win_Mac.png)

How to Draw EPC Diagram Quickly


- How to Draw a Divided Bar Chart in ConceptDraw PRO | Divided ...
- Bar Diagram Math | Rainfall Bar Chart | Process Flowchart | Images ...
- Divided Bar Diagrams
- Using Fishbone Diagrams for Problem Solving | Fishbone Diagram ...
- Divided bar diagram - Template
- London election results - Divided bar diagram | Bar Diagram Math ...
- 3 Bar Diagram
- Venn Diagram Examples for Problem Solving. Computer Science ...
- Rectangular Bar Diagram
- How to Create a Bar Chart | Process Flowchart | Components of ER ...
- Divided bar diagrams - Vector stencils library | Bar Diagram Math ...
- Bar Graphs | Bar Diagram Math | Rainfall Bar Chart | Divided Simple ...
- Physics Diagrams | Mathematical Diagrams | Bar Diagram Math ...
- Bar Diagram Math | Divided Bar Diagrams | Double bar graph ...
- Bar Diagram Of Project
- Divided Bar Diagrams
- Data Flow Diagram Model | Process Flowchart | Bar Diagrams for ...
- Bar Diagram Showing Different Elements Of Air
- Bar Diagram Math | Divided bar diagram - Template | London ...
- Bar Diagram Math | Pie Charts | Top iPad Business Process ...