The vector stencils library "Medicine and health pictograms" contains 20 icons of medical and healthcare symbols.
Use it to draw your medical and healthcare infographics.
The example "Medicine and health pictograms - Vector stencils library" was created using the ConceptDraw PRO diagramming and vector drawing software extended with the Pictorial infographics solution from the area "What is infographics" in ConceptDraw Solution Park.
Awareness ribbon

Cardiogram
Stethoscope

Calling an ambulance
Tooth
DNA

First aid

Syringe
Thermometer

Lungs
Medicament
Pills
Patch
Stomach

Hospital

Dropper

Glasses

Case report
Crutches

Pharmacy
Pyramid Chart Examples

The vector stencils library "Medicine and health pictograms" contains 20 icons of medical and healthcare symbols.
Use it to draw your medical and healthcare infographics.
The example "Medicine and health pictograms - Vector stencils library" was created using the ConceptDraw PRO diagramming and vector drawing software extended with the Pictorial infographics solution from the area "What is infographics" in ConceptDraw Solution Park.
Use it to draw your medical and healthcare infographics.
The example "Medicine and health pictograms - Vector stencils library" was created using the ConceptDraw PRO diagramming and vector drawing software extended with the Pictorial infographics solution from the area "What is infographics" in ConceptDraw Solution Park.
Awareness ribbon
Cardiogram
Stethoscope
Calling an ambulance
Tooth
DNA
First aid
Syringe
Thermometer
Lungs
Medicament
Pills
Patch
Stomach
Hospital
Dropper
Glasses
Case report
Crutches
Pharmacy
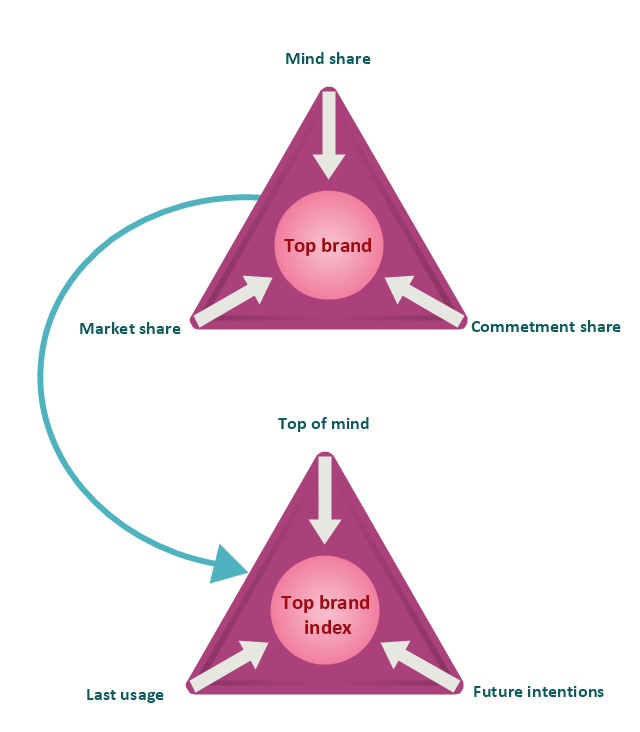
"Brand awareness refers to customers' ability to recall and recognize the brand under different conditions and link to the brand name, logo, jingles and so on to certain associations in memory. It consists of both brand recognition and brand recall. It helps the customers to understand to which product or service category the particular brand belongs and what products and services are sold under the brand name. It also ensures that customers know which of their needs are satisfied by the brand through its products (Keller). Brand awareness is of critical importance since customers will not consider your brand if they are not aware of it. There are various levels of brand awareness that require different levels and combinations of brand recognition and recall. Top-of-Mind is the goal of most companies. Top-of-mind awareness occurs when your brand is what pops into a consumers mind when asked to name brands in a product category." [Brand. Brand awareness. Wikipedia]
This top brand model pyramid diagram was redesigned using the ConceptDraw PRO diagramming and vector drawing software from Wikimedia Commons file Diagram Top Brand Model.jpg. [commons.wikimedia.org/ wiki/ File:Diagram_ Top_ Brand_ Model.jpg]
This file is licensed under the Creative Commons Attribution-Share Alike 3.0 Unported license. [creativecommons.org/ licenses/ by-sa/ 3.0/ deed.en]
The example "Top brand model pyramid diagram" is included in the Pyramid Diagrams solution from the Marketing area of ConceptDraw Solution Park.
Triangular charts
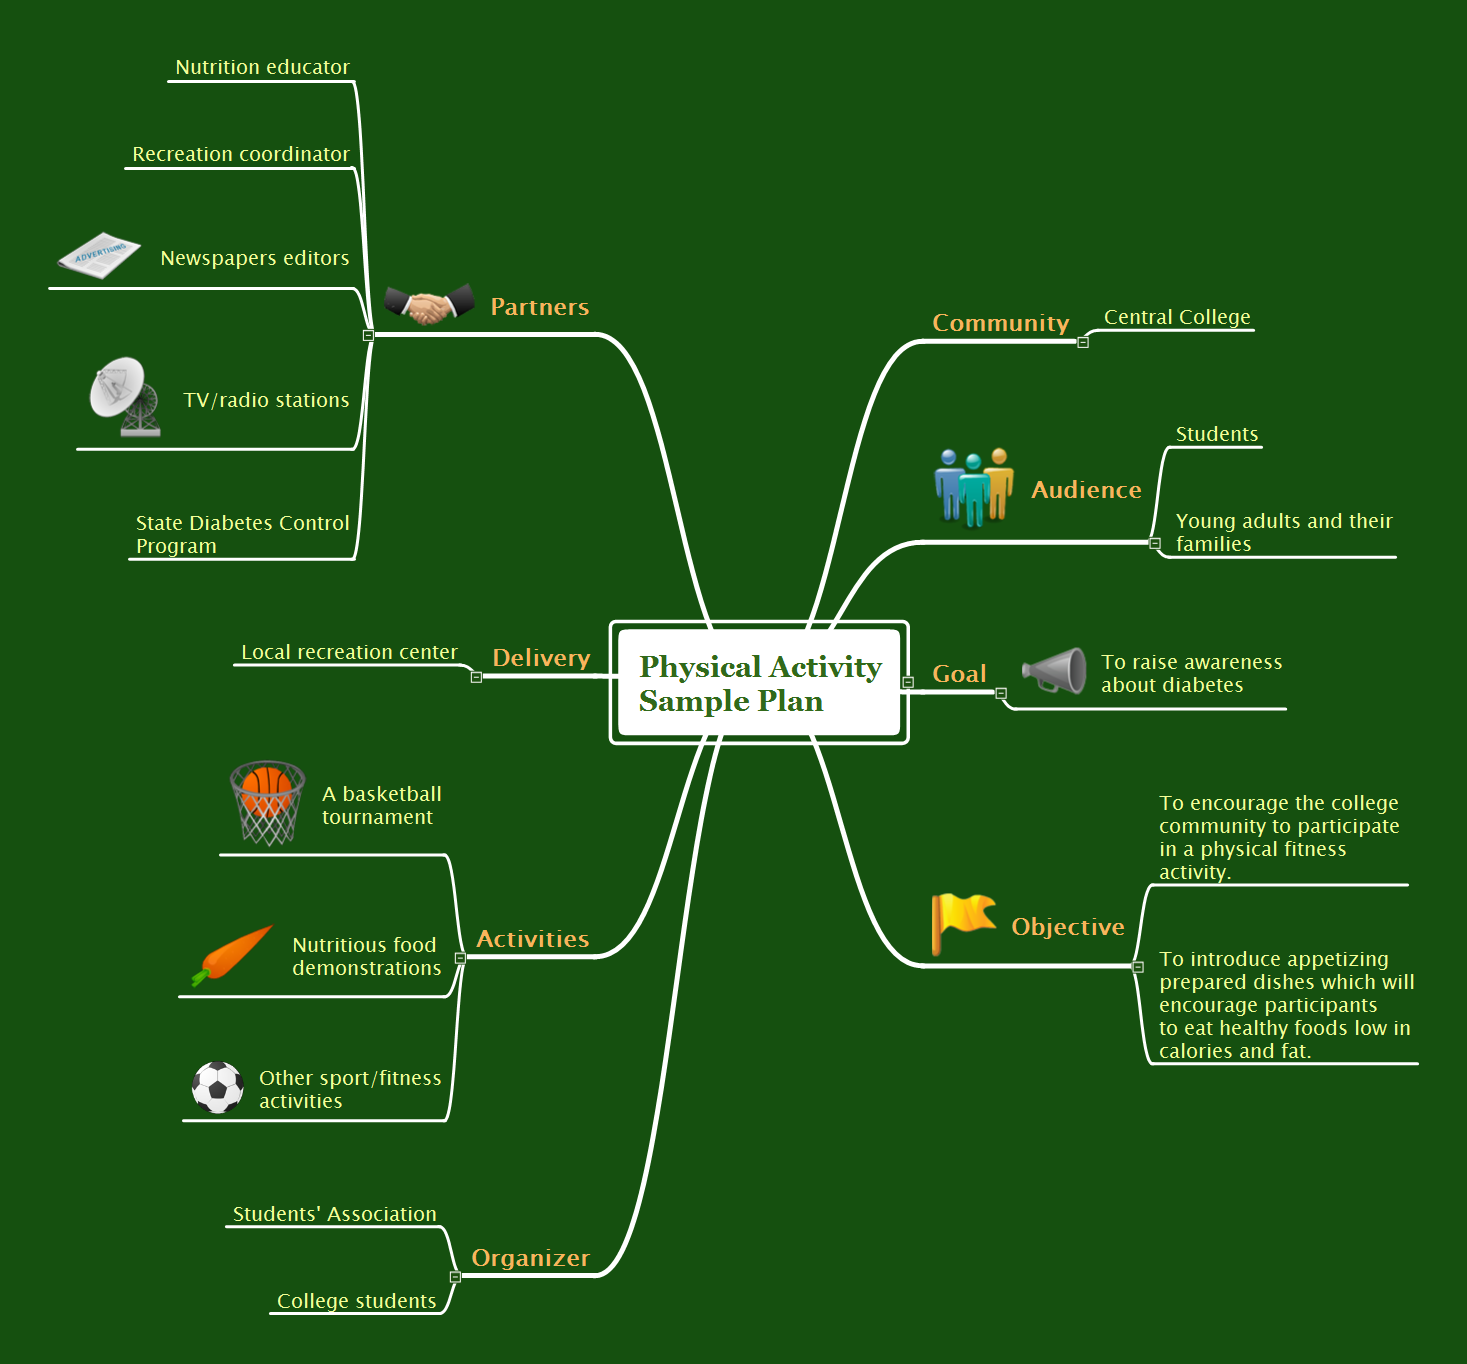
Physical Activity Plan
Design Pictorial Infographics. Design Infographics

What is SWOT Analysis in Marketing

HelpDesk
How to Make a Logistic Dashboard

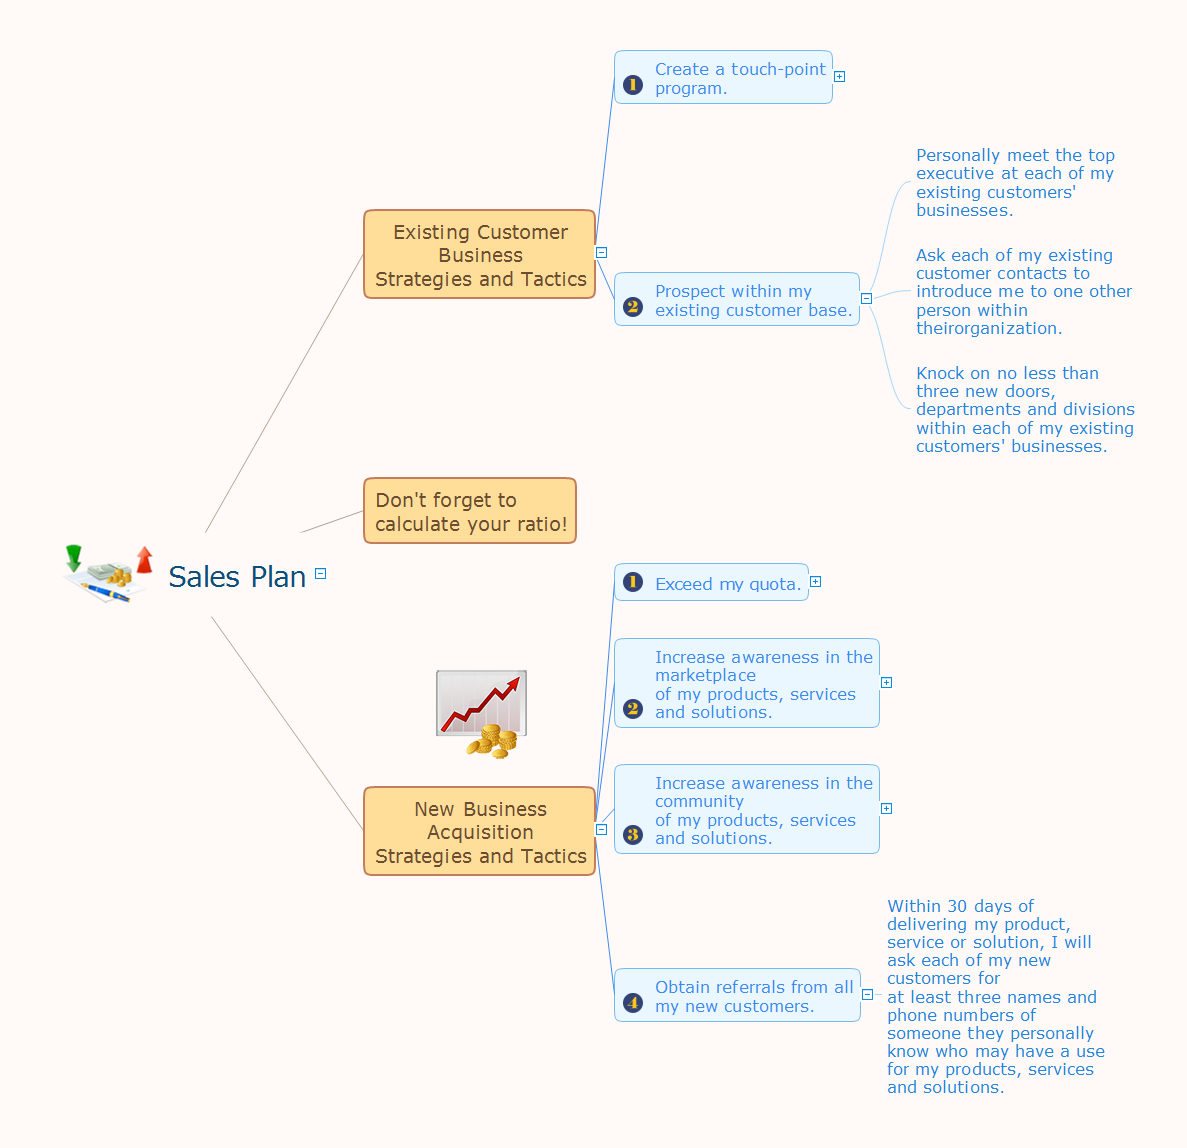
Sales Plan
Infographic Maker

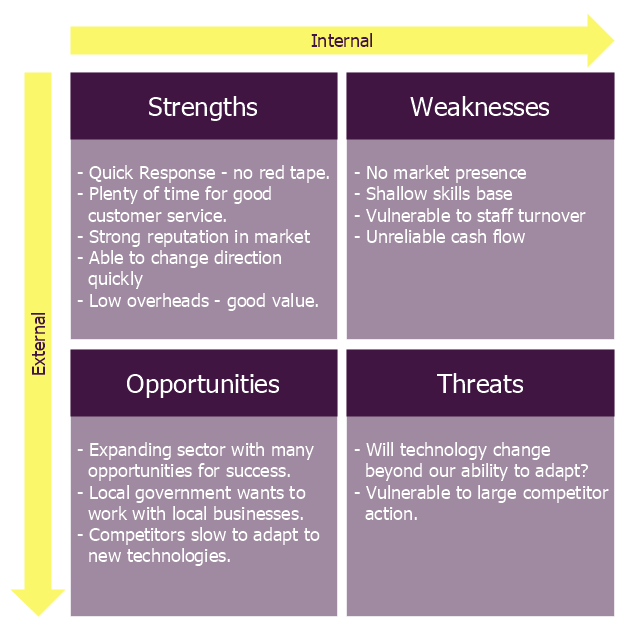
"The name says it: Strength, Weakness, Opportunity, Threat. A SWOT analysis guides you to identify the positives and negatives inside your organization (S-W) and outside of it, in the external environment (O-T). Developing a full awareness of your situation can help with both strategic planning and decision-making.
The SWOT method (which is sometimes called TOWS) was originally developed for business and industry, but it is equally useful in the work of community health and development, education, and even personal growth.
SWOT is not the only assessment technique you can use, but is one with a long track record of effectiveness. The strengths of this method are its simplicity and application to a variety of levels of operation." [ctb.ku.edu/ en/ table-of-contents/ assessment/ assessing-community-needs-and-resources/ swot-analysis/ main]
The diagram example "Small business consultancy SWOT analysis matrix" was created using the ConceptDraw PRO diagramming and vector drawing software extended with the SWOT Analysis solution from the Management area of ConceptDraw Solution Park.
SWOT matrix
Successful Strategic Plan

SWOT Matrix

SWOT Analysis

SWOT Matrix Software

- Ribbon Vector Awareness
- Charity Ribbon Vector
- Medicine and health pictograms - Vector stencils library | Medicine ...
- Medicine and health pictograms - Vector stencils library | Medicine ...
- Medicine and health pictograms - Vector stencils library | Medicine ...
- Medicine and health pictograms - Vector stencils library | Healthy ...
- Medicine Vector Png Image
- Medicine and health pictograms - Vector stencils library | Road ...
- Brand Awareness Pyramid Top Of Mind
- Brand Awareness Pyramid Examples
- Medicine and health pictograms - Vector stencils library
- Design Pictorial Infographics. Design Infographics | Medicine and ...
- Medicine and health pictograms - Vector stencils library | Bathroom ...
- Design elements - Medicine and health pictograms | Medicine and ...
- Ribbon Png Vector For Food
- Rectangular Ribbon Png
- Brand essence model - Wheel diagram | Competitor Analysis ...
- Design elements - Yosemite Apps | App icons - Vector stencils ...
- Design Pictorial Infographics. Design Infographics | Design ...
- Education pictograms - Vector stencils library | Pyramid Chart ...