This site uses cookies. By continuing to browse the ConceptDraw site you are agreeing to our Use of Site Cookies.

Process Flowchart

ConceptDraw is Professional business process mapping software for making process flow diagram, workflow diagram, general flowcharts and technical illustrations for business documents. It is includes rich examples, templates, process flowchart symbols. ConceptDraw flowchart maker allows you to easier create a process flowchart. Use a variety of drawing tools, smart connectors, flowchart symbols and shape libraries to create flowcharts of complex processes, process flow diagrams, procedures and information exchange.
How To Create a Process Flow Chart (business process modelling techniques)

histogram, flow chart, pareto chart, fishbone diagram, quality control Seven Basic Tools of Quality

histogram, flow chart, pareto chart, fishbone diagram, quality control
Manage quality control in the workplace, using fishbone diagrams, flowcharts, Pareto charts and histograms, provided by the Seven Basic Tools of Quality solution.

Flow chart Example. Warehouse Flowchart

Warehouse Flowcharts are different diagrams describing wharehousing and inventory menagement processes. Typical purposes of warehouse flowcharts are evaluating warehouse performance and organizational performance, measuring efficiency of customer service. This type of workflow diagrams can be used for identifying any disconnection between business activities and business objectives.
Standard warehousing process flow diagram and standard workflow diagram used for process identification for further evaluating effectiveness and profitability of overall business process. Use the ConceptDraw PRO diagramming and vector drawing software extended with the Flowcharts solution from the Diagrams area of ConceptDraw Solution Park to design your own workflow diagrams, process flow diagram and flow charts. Need to use Process Flow Diagram for designing Warehouse packages flow.
ConceptDraw Arrows10 Technology

fishbone diagram, Ishikawa diagram, cause and effect analysis Fishbone Diagram

fishbone diagram, Ishikawa diagram, cause and effect analysis
Fishbone Diagrams solution extends ConceptDraw PRO software with templates, samples and library of vector stencils for drawing the Ishikawa diagrams for cause and effect analysis.

UML Component Diagram. Design Elements

UML Component Diagram illustrates show components are wired together to larger components and software systems that shows the structure of arbitrarily complex systems.
Rapid UML Solution for ConceptDraw PRO contains 13 vector stencils libraries with 393 interactive shapes that you can use to design your UML diagrams.
To design a Component Diagram use the UML Component Diagram library.
UML Component Diagram library contains 36 shapes

UML Deployment Diagram. Design Elements

UML Deployment diagram describes the hardware used in system implementations and the execution environments and artifacts deployed on the hardware.
ConceptDraw has 393 vector stencils in the 13 libraries that helps you to start using software for designing your own UML Diagrams. You can use the appropriate stencils of UML notation from UML Deployment library.

UML Collaboration Diagram. Design Elements

UML Collaboration Diagram illustrates how components are wired together to larger components and software systems that shows the structure of arbitrarily complex systems.
ConceptDraw has 393 vector stencils in the 13 libraries that helps you to start using software for designing your own UML Diagrams. You can use the appropriate stencils of UML notation from UML Collaboration library with 36 objects
HelpDesk

How to Create a Mechanical Diagram

Mechanical Engineering drawing is a type of technical drawing that helps analyze complex engineering systems. Mechanical Engineering diagrams are often a set of detailed drawings used for engineering or construction projects.
Making Mechanical Engineering diagram involves many different elements that can be managed using ConceptDraw PRO. You can design elements for drawing parts, assembly, pneumatic, and hydraulic systems for mechanical engineering. With ConceptDraw PRO you can easily create and communicate the Mechanical Engineering diagram of any complexity.

mechanical engineering, mechanical design software, mechanical drawing symbols, mechanical drawing software Mechanical Engineering

mechanical engineering, mechanical design software, mechanical drawing symbols, mechanical drawing software
This solution extends ConceptDraw PRO v.9 mechanical drawing software (or later) with samples of mechanical drawing symbols, templates and libraries of design elements, for help when drafting mechanical engineering drawings, or parts, assembly, pneumatic,
HelpDesk

How to Create a BPMN Diagram Using ConceptDraw PRO

Business Process Modeling Notation (BPMN) is a method of illustrating business processes in the form of a diagram. The most effective method of creating or analyzing a business process is to visually interpret the steps using a business process diagram, flowchart or workflow. This is known as business process modeling, and will be performed within a company by a team who have detailed knowledge of company process, and analysts with expertise in the modeling discipline. The objective is often to increase production or lower costs — by modeling the process initially using a flowchart, inefficiencies and problems can be spotted before committing to a decision or strategy. You can create BPMN diagrams using the ConceptDraw PRO diagramming tools. ConceptDraw have designed a solution that combines BPMN v2.0 methodology and graphical notification into one powerful package. The Business Process Diagrams solution from ConceptDraw Solution Park provides a comprehensive collection of vector

UML State Machine Diagram.Design Elements

UML state machine's goal is to overcome the main limitations of traditional finite-state machines while retaining their main benefits.
ConceptDraw has 393 vector stencils in the 13 libraries that helps you to start using software for designing your own UML Diagrams. You can use the appropriate stencils of UML notation from UML State Machine library.
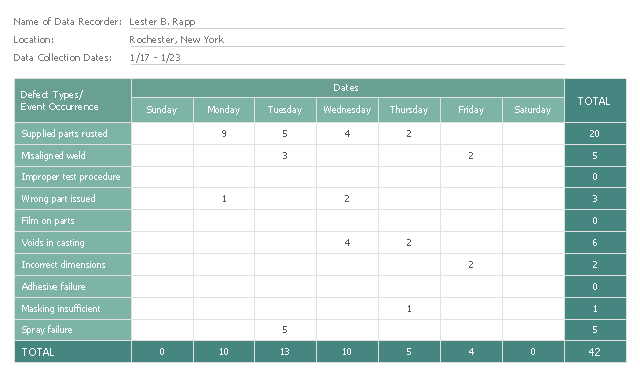
This check sheet example was redesigned from the Wikimedia Commons file: Check sheet for motor assembly.svg. [commons.wikimedia.org/ wiki/ File:Check_ sheet_ for_ motor_ assembly.svg]
This file is licensed under the Creative Commons Attribution-Share Alike 3.0 Unported license. [creativecommons.org/ licenses/ by-sa/ 3.0/ deed.en]
"The check sheet is a form (document) used to collect data in real time at the location where the data is generated. The data it captures can be quantitative or qualitative. When the information is quantitative, the check sheet is sometimes called a tally sheet.
The check sheet is one of the so-called Seven Basic Tools of Quality Control. ...
Kaoru Ishikawa identified five uses for check sheets in quality control:
- To check the shape of the probability distribution of a process
- To quantify defects by type
- To quantify defects by location
- To quantify defects by cause (machine, worker)
- To keep track of the completion of steps in a multistep procedure (in other words, as a checklist)" [. Wikipedia]
The example "Check sheet for motor assembly" was created using the ConceptDraw PRO software extended with the Seven Basic Tools of Quality solution from the Quality area of ConceptDraw Solution Park.
Check sheet example
Check sheet example, weekly check sheet, title text block,

UML Package Diagram. Design Elements

UML Package Diagram illustrates the functionality of a software system.
ConceptDraw has 393 vector stencils in the 13 libraries that helps you to start using software for designing your own UML Diagrams. You can use the appropriate stencils of UML notation from UML Package library.

Technical Drawing Software

Technical Drawing Software for drawing technical diagram, electrical and technical drawing. Download Drawing Software ConcepDraw for Free.
ConceptDraw PRO extended with: Mechanical Engineering Solution, Electrical Engineering Solution, Chemical and Process Engineering Solution from the Industrial Engineering Area is powerful software for business and technical drawing. Its powerful drawing tools, predesigned vector objects, templates, samples are helpful for creation all kinds of Technical Drawings and Technical Diagrams, Electrical and Mechanical Schematics, Circuit and Wiring Diagrams, Structural Drawings, and many other.

Cross-Functional Flowchart

Cross-Functional Flowchart - to draw cross functional process maps is by starting with a cross-functional flowchart samples and templates. Easy to draw sample cross functional Process Flow Diagrams. Using a Cross-Functional flowchart is a clear way of showing each team member’s responsibilities and how processes get shared or transferred between different teams and departments.
Use cross-functional flowcharts to show the relationship between a business process and the functional units (such as departments) responsible for that process. To create it use the best flowchart maker of ConceptDraw PRO.
How to Draw a Cross Functional Flowchart using visio alternative ConceptDraw PRO as visio for mac