This example of cloud computing system architecture diagram was redesigned from the Wikimedia Commons file: ArchitectureCloudLinksSameSite.png. [commons.wikimedia.org/ wiki/ File:ArchitectureCloudLinksSameSite.png]
"An example showing a grid computing system connecting many personal computers over the Internet using inter-process network communication ...
In computer science, inter-process communication (IPC) is the activity of sharing data across multiple and commonly specialized processes using communication protocols. Typically, applications using IPC are categorized as clients and servers, where the client requests data and the server responds to client requests." [en.wikipedia.org/ wiki/ Inter-process_ communication]
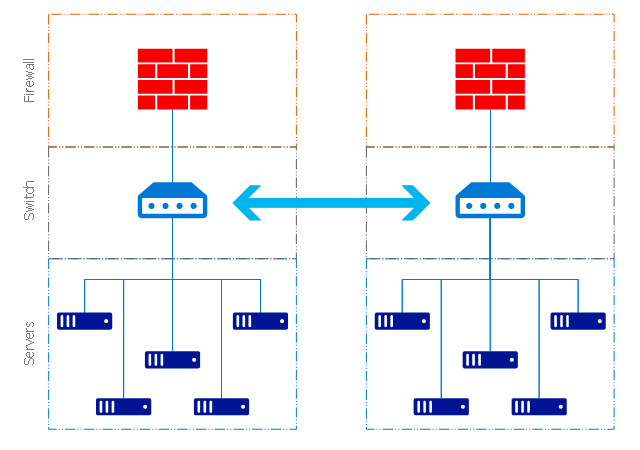
"Grid computing is the collection of computer resources from multiple locations to reach a common goal. The grid can be thought of as a distributed system with non-interactive workloads that involve a large number of files. Grid computing is distinguished from conventional high performance computing systems such as cluster computing in that grid computers have each node set to perform a different task/ application. Grid computers also tend to be more heterogeneous and geographically dispersed (thus not physically coupled) than cluster computers." [Grid computing. Wikipedia]
The diagram example "Grid computing system architecture" was created using ConceptDraw PRO diagramming and vector drawing software extended with the Azure Architecture solution from the Computer and Networks area of ConceptDraw Solution Park.
"An example showing a grid computing system connecting many personal computers over the Internet using inter-process network communication ...
In computer science, inter-process communication (IPC) is the activity of sharing data across multiple and commonly specialized processes using communication protocols. Typically, applications using IPC are categorized as clients and servers, where the client requests data and the server responds to client requests." [en.wikipedia.org/ wiki/ Inter-process_ communication]
"Grid computing is the collection of computer resources from multiple locations to reach a common goal. The grid can be thought of as a distributed system with non-interactive workloads that involve a large number of files. Grid computing is distinguished from conventional high performance computing systems such as cluster computing in that grid computers have each node set to perform a different task/ application. Grid computers also tend to be more heterogeneous and geographically dispersed (thus not physically coupled) than cluster computers." [Grid computing. Wikipedia]
The diagram example "Grid computing system architecture" was created using ConceptDraw PRO diagramming and vector drawing software extended with the Azure Architecture solution from the Computer and Networks area of ConceptDraw Solution Park.
Grid computing system architecture diagram
This example of cloud computing system architecture diagram was redesigned from the Wikimedia Commons file: ArchitectureCloudLinksSameSite.png. [commons.wikimedia.org/ wiki/ File:ArchitectureCloudLinksSameSite.png]
"An example showing a grid computing system connecting many personal computers over the Internet using inter-process network communication ...
In computer science, inter-process communication (IPC) is the activity of sharing data across multiple and commonly specialized processes using communication protocols. Typically, applications using IPC are categorized as clients and servers, where the client requests data and the server responds to client requests." [en.wikipedia.org/ wiki/ Inter-process_ communication]
"Grid computing is the collection of computer resources from multiple locations to reach a common goal. The grid can be thought of as a distributed system with non-interactive workloads that involve a large number of files. Grid computing is distinguished from conventional high performance computing systems such as cluster computing in that grid computers have each node set to perform a different task/ application. Grid computers also tend to be more heterogeneous and geographically dispersed (thus not physically coupled) than cluster computers." [Grid computing. Wikipedia]
The diagram example "Grid computing system architecture" was created using ConceptDraw PRO diagramming and vector drawing software extended with the Azure Architecture solution from the Computer and Networks area of ConceptDraw Solution Park.
Grid computing system architecture diagram
 Safety and Security
Safety and security solution extends ConceptDraw DIAGRAM software with illustration samples, templates and vector stencils libraries with clip art of fire safety, access and security equipment.
Example Process Flow

 AWS Architecture Diagrams
AWS Architecture Diagrams with powerful drawing tools and numerous predesigned Amazon icons and AWS simple icons is the best for creation the AWS Architecture Diagrams, describing the use of Amazon Web Services or Amazon Cloud Services, their application for development and implementation the systems running on the AWS infrastructure. The multifarious samples give you the good understanding of AWS platform, its structure, services, resources and features, wide opportunities, advantages and benefits from their use; solution’s templates are essential and helpful when designing, description and implementing the AWS infrastructure-based systems. Use them in technical documentation, advertising and marketing materials, in specifications, presentation slides, whitepapers, datasheets, posters, etc.
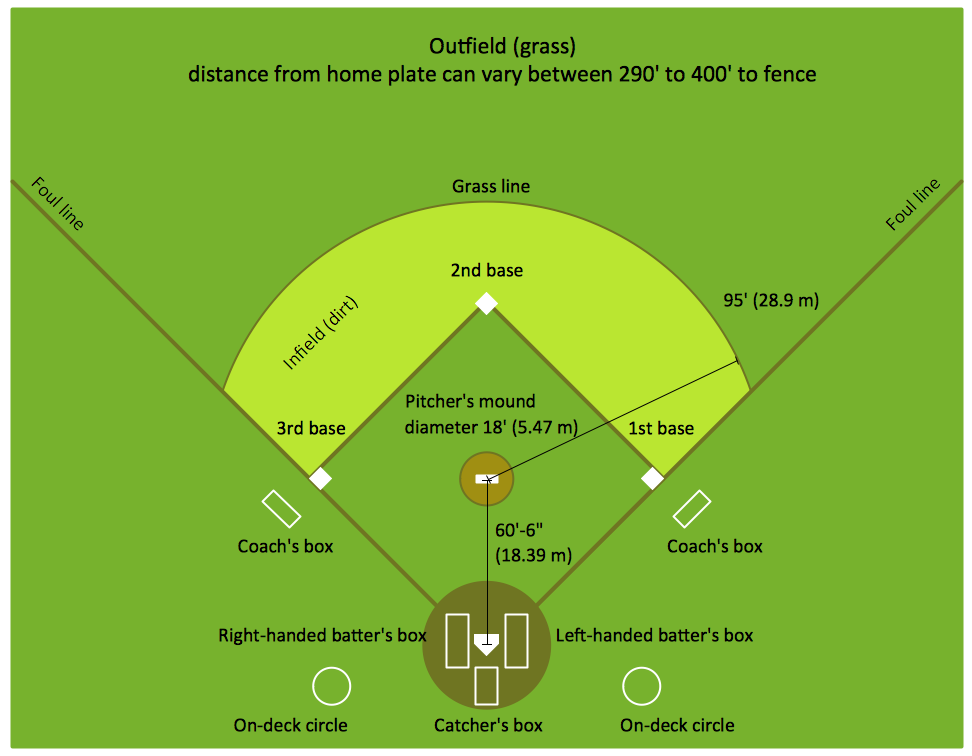
Baseball Diagram – Colored Baseball Field
Entity Relationship Diagram - ERD - Software for Design Crows Foot ER Diagrams
_Win_Mac.png)

I Formation (Offense) Diagram
-Sample.png)
 Entity-Relationship Diagram (ERD)
Entity-Relationship Diagram (ERD) solution extends ConceptDraw DIAGRAM software with templates, samples and libraries of vector stencils from drawing the ER-diagrams by Chen's and crow’s foot notations.
 Food Court
Use the Food Court solution to create food art. Pictures of food can be designed using libraries of food images, fruit art and pictures of vegetables.
Flow Map

ERD Symbols and Meanings

Accounting Flowchart Purchasing Receiving Payable and Payment

Accounting Flowchart Symbols

- Vector Arrows Architecture
- Grid computing system architecture
- Grid computing system architecture | Server | Diagramming tool ...
- Grid computing system architecture
- Grid computing system architecture | Cloud Computing | Azure ...
- Grid Computing Architecture Diagram
- Grid computing system architecture | Basic Flowchart Symbols and ...
- Grid computing system architecture | Ring Network Topology | Cloud ...
- Arrow Png
- ERD Symbols and Meanings | Entity Relationship Diagram Symbols ...
- What Is Gride Computing With Diagram
- Circular Arrows Diagrams | Total Quality Management TQM ...
- Grid Network Topology | Grid computing system architecture ...
- Grid Computing With Diagram
- Cloud Computing | Grid computing system architecture | Design ...
- Enterprise Architecture Diagrams | Grid computing system ...
- Mobile cloud architecture diagram | Grid computing system ...
- | Grid computing system architecture | | Cloud Computing Wiki
- How To Draw A Direction Map On Poster
- Entity Relationship Diagram - ERD - Software for Design Crows Foot ...