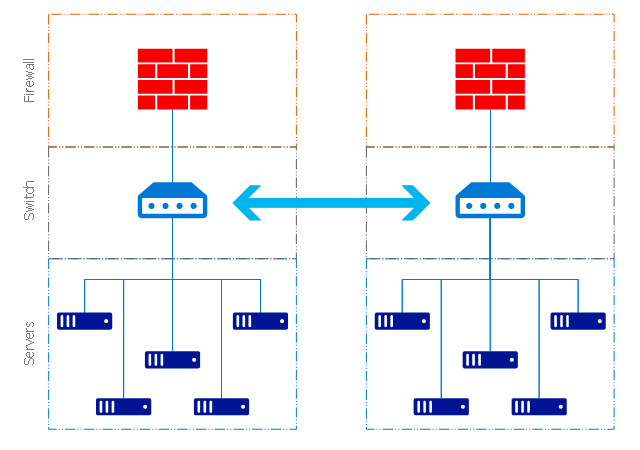
Grid Network Topology

This example of cloud computing system architecture diagram was redesigned from the Wikimedia Commons file: ArchitectureCloudLinksSameSite.png. [commons.wikimedia.org/ wiki/ File:ArchitectureCloudLinksSameSite.png]
"An example showing a grid computing system connecting many personal computers over the Internet using inter-process network communication ...
In computer science, inter-process communication (IPC) is the activity of sharing data across multiple and commonly specialized processes using communication protocols. Typically, applications using IPC are categorized as clients and servers, where the client requests data and the server responds to client requests." [en.wikipedia.org/ wiki/ Inter-process_ communication]
"Grid computing is the collection of computer resources from multiple locations to reach a common goal. The grid can be thought of as a distributed system with non-interactive workloads that involve a large number of files. Grid computing is distinguished from conventional high performance computing systems such as cluster computing in that grid computers have each node set to perform a different task/ application. Grid computers also tend to be more heterogeneous and geographically dispersed (thus not physically coupled) than cluster computers." [Grid computing. Wikipedia]
The diagram example "Grid computing system architecture" was created using ConceptDraw PRO diagramming and vector drawing software extended with the Azure Architecture solution from the Computer and Networks area of ConceptDraw Solution Park.
Grid computing system architecture diagram
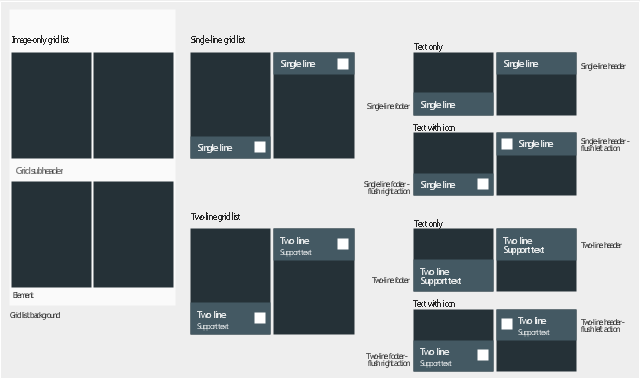
The vector stencils library "Android grids" contains 13 grid elements.
Use it to design user interface of your Android application.
The shapes example "Design elements - Android grids" was created using the ConceptDraw PRO diagramming and vector drawing software extended with the "Android user interface" solution from the "Software Development" area of ConceptDraw Solution Park.
Grid shapes
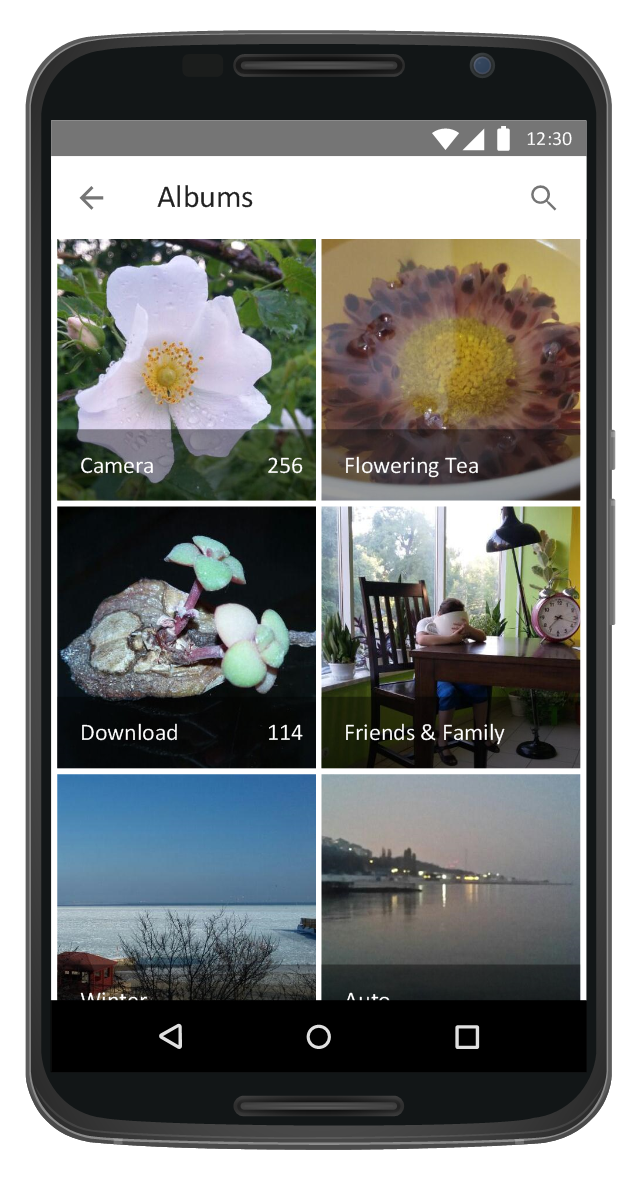
This Android 7 user interface example illustrates usage of Android Material Design single-line grid list.
"Grid lists are an alternative to standard list views.
A grid list consists of a repeated pattern of cells arrayed in a vertical and horizontal layout.
Grid lists are best used on similar data types. They help improve the visual comprehension of the content they contain. ...
A grid list is best suited to presenting homogenous data, typically images, and is optimized for visual comprehension and differentiating between similar data types. ...
A grid list consists of a repeated pattern of cells arrayed vertically and horizontally within the grid list.
Tiles hold content and can span one or more cells vertically or horizontally." [material.io/ guidelines/ components/ grid-lists.html]
The Android 7 UI design example "Single-line grid list" was created using the ConceptDraw PRO diagramming and vector drawing software extended with the "Android user interface" solution from the "Software Development" area of ConceptDraw Solution Park.
Single-line grid list
Toroidal Network Topology

Wireframing

"A chart can take a large variety of forms, however there are common features that provide the chart with its ability to extract meaning from data.
Typically the data in a chart is represented graphically, since humans are generally able to infer meaning from pictures quicker than from text. Text is generally used only to annotate the data.
One of the more important uses of text in a graph is the title. A graph's title usually appears above the main graphic and provides a succinct description of what the data in the graph refers to.
Dimensions in the data are often displayed on axes. If a horizontal and a vertical axis are used, they are usually referred to as the x-axis and y-axis respectively. Each axis will have a scale, denoted by periodic graduations and usually accompanied by numerical or categorical indications. Each axis will typically also have a label displayed outside or beside it, briefly describing the dimension represented. If the scale is numerical, the label will often be suffixed with the unit of that scale in parentheses. ...
Within the graph a grid of lines may appear to aid in the visual alignment of data. The grid can be enhanced by visually emphasizing the lines at regular or significant graduations. The emphasized lines are then called major grid lines and the remainder are minor grid lines.
The data of a chart can appear in all manner of formats, and may include individual textual labels describing the datum associated with the indicated position in the chart. The data may appear as dots or shapes, connected or unconnected, and in any combination of colors and patterns. Inferences or points of interest can be overlaid directly on the graph to further aid information extraction.
When the data appearing in a chart contains multiple variables, the chart may include a legend (also known as a key). A legend contains a list of the variables appearing in the chart and an example of their appearance. This information allows the data from each variable to be identified in the chart." [Chart. Wikipedia]
The vector stencils library "Time series charts" contains 10 templates: 3 column charts, 3 bar charts, 2 line graphs and 2 dot plots. All these charts are Live Objects displaying the data from external data source files.
Use these chart templates to design your business performance digital dashboards using the ConceptDraw PRO diagramming and vector drawing software.
The example "Design elements - Time series charts" is included in the Time Series Dashboard solution from the area "What is a Dashboard" of ConceptDraw Solution Park.
Time series charts

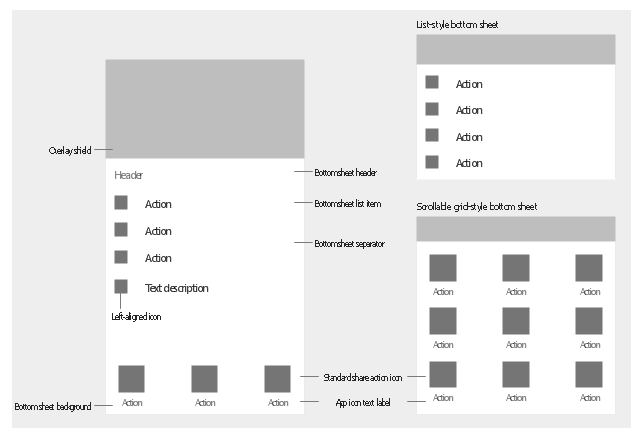
The vector stencils library "Android bottom sheets" contains 11 bottom sheet elements.
Use it to design user interface of your Android application.
The shapes example "Design elements - Android bottom sheets" was created using the ConceptDraw PRO diagramming and vector drawing software extended with the "Android user interface" solution from the "Software Development" area of ConceptDraw Solution Park.
Bottom sheet elements
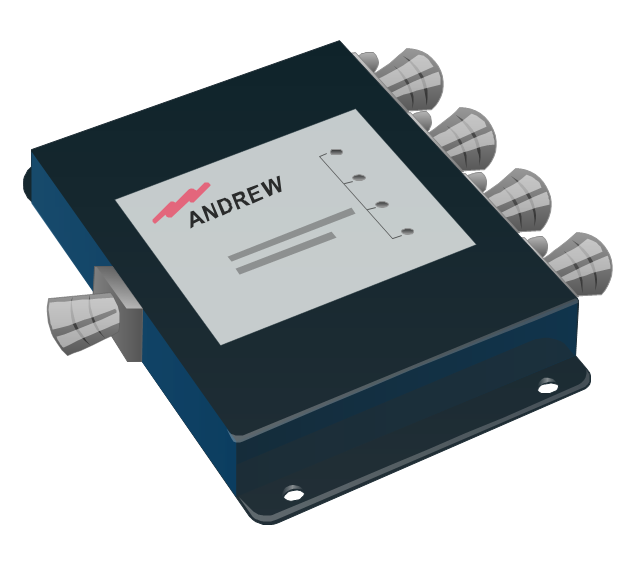
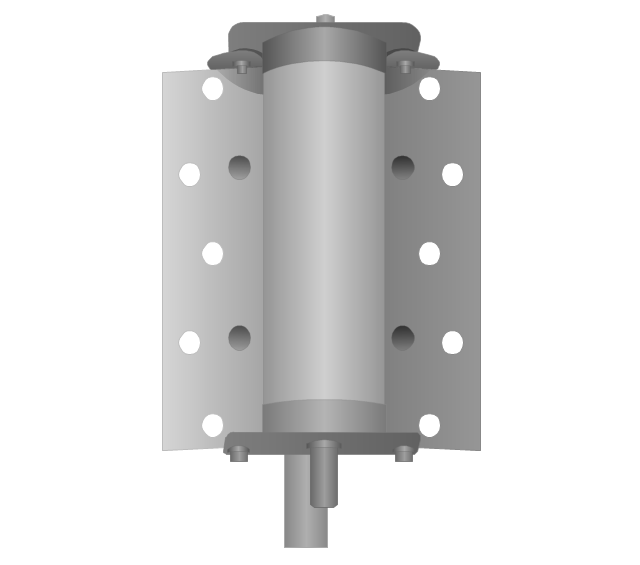
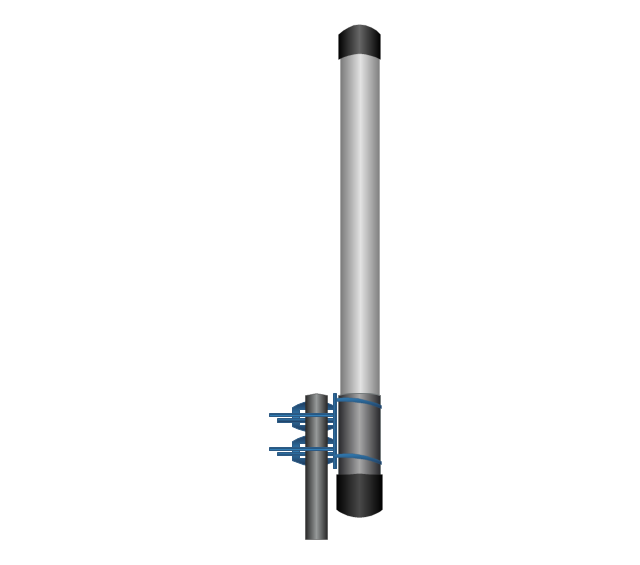
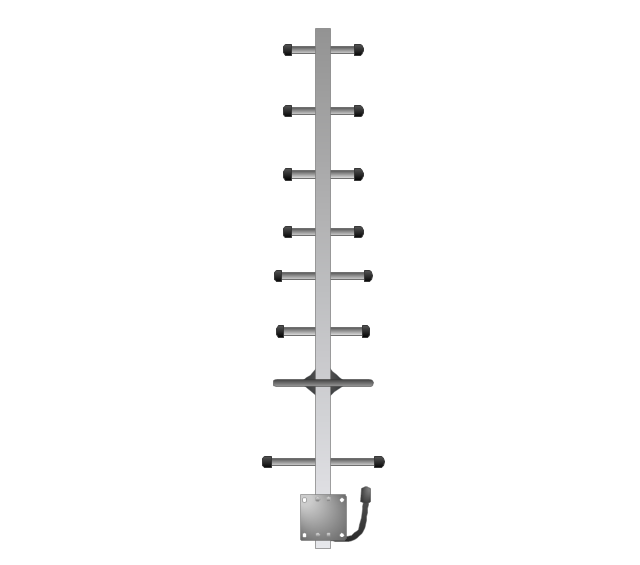
The vector stencils library "Telecom equipment" contains 11 hardware clipart icons of telecommunication devices for drawing computer network diagrams and equipment layouts.
"In telecommunication, a communications system is a collection of individual communications networks, transmission systems, relay stations, tributary stations, and data terminal equipment (DTE) usually capable of interconnection and interoperation to form an integrated whole. The components of a communications system serve a common purpose, are technically compatible, use common procedures, respond to controls, and operate in union. Telecommunications is a method of communication." [Communications system. Wikipedia]
"A basic telecommunication system consists of three primary units that are always present in some form: (1) A transmitter that takes information and converts it to a signal. (2) A transmission medium, also called the "physical channel" that carries the signal. ... (3) A receiver that takes the signal from the channel and converts it back into usable information." [Telecommunication. Wikipedia]
The clip art example "Telecom equipment - Vector stencils library" was created using the ConceptDraw PRO diagramming and vector drawing software extended with the Telecommunication Network Diagrams solution from the Computer and Networks area of ConceptDraw Solution Park.
Andrew multiband high / low power splitter
Andrew multi-band indoor omnidirectional antenna

Panel sector directional antenna
Omni directional antenna
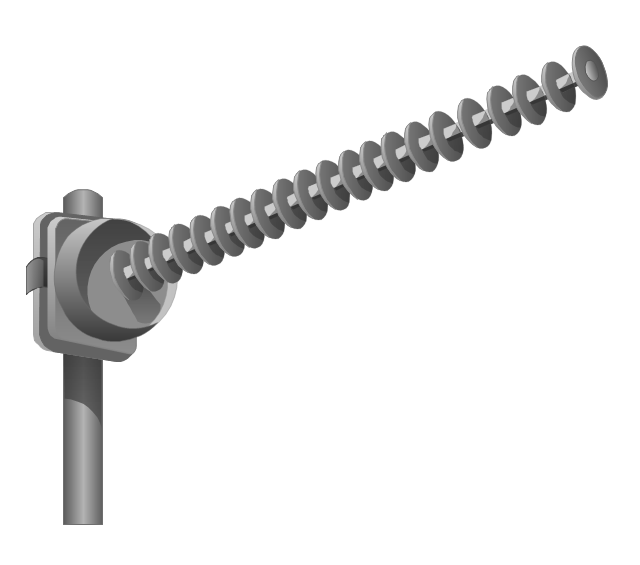
Yagi directional antenna
Yagi integrated downconverter
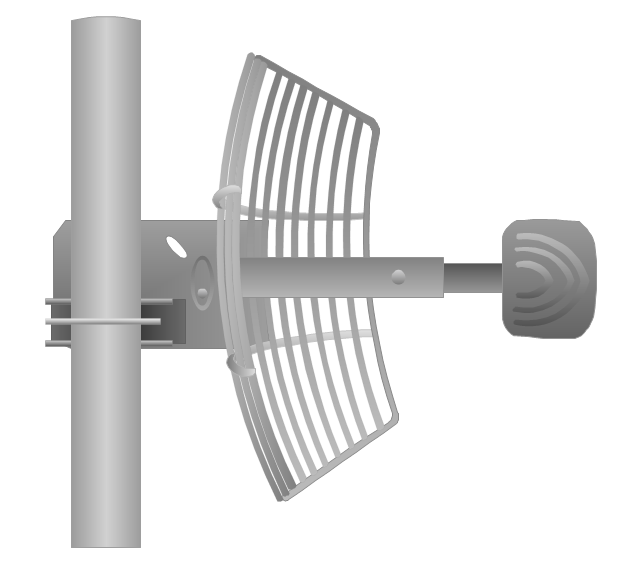
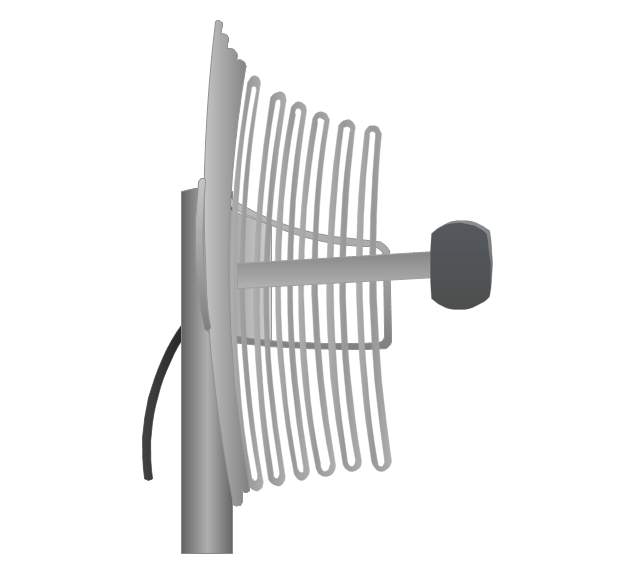
Grid antenna
Loop antenna
FireTide HotPort® 6000 wireless mesh nodes
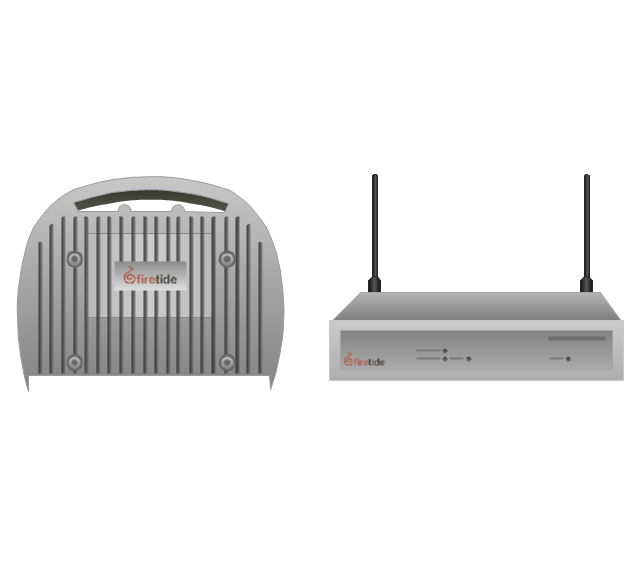
FireTide HotPoint® wireless access point
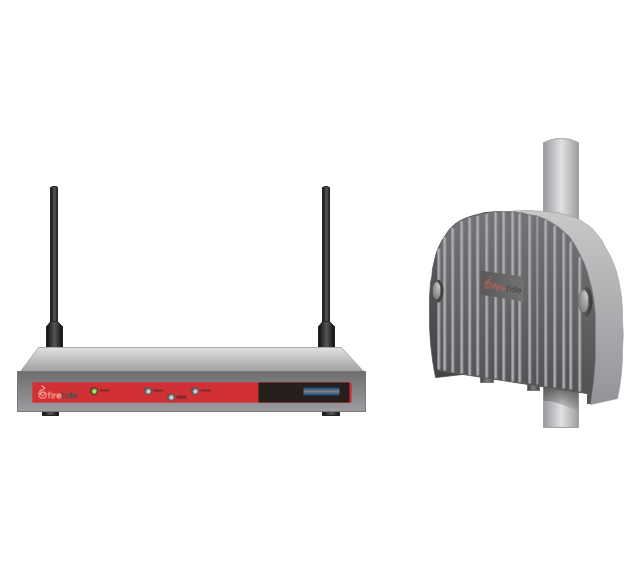
FireTide HotClient Customer Premises Equipment (CPE)
-telecom-equipment---vector-stencils-library.png--diagram-flowchart-example.png)
Data Flow Diagram Software

ConceptDraw Arrows10 Technology

TOWS Analysis Software

Hypercube Network Topology

Site Plan Software

- Grid Architecture For Diagram
- Grid computing system architecture | Cloud Computing Architecture ...
- Grid computing system architecture
- Grid Network Topology | Data Flow Diagram Software | Azure ...
- Design elements - Android grids | Design elements - Wireframe grid ...
- Diagrame Of Grid Compunting
- Grid Network Topology | Toroidal Network Topology | Hypercube ...
- Grid Network Topology | Toroidal Network Topology | How to Draw a ...
- Design elements - Wireframe grid | Bootstrap Wire Frame
- Grid computing system architecture | Cloud Computing | Azure ...
- Grid Computing With Diagram
- Android 5.0 - Single-line list | Single-line grid list | Process Flowchart ...
- Grid Network Topology | How to Draw a Computer Network ...
- 960 Grid System 16-column layout | User registration form | Website ...
- Grid computing system architecture | Grid Network Topology | Cloud ...
- Network Topologies | Ring Network Topology | Grid Network ...
- Block Diagram Of Grid In Grid And Cloud Computing
- User registration form | 960 Grid System 16-column layout | 960gs
- Diagram Architecture Of Grid