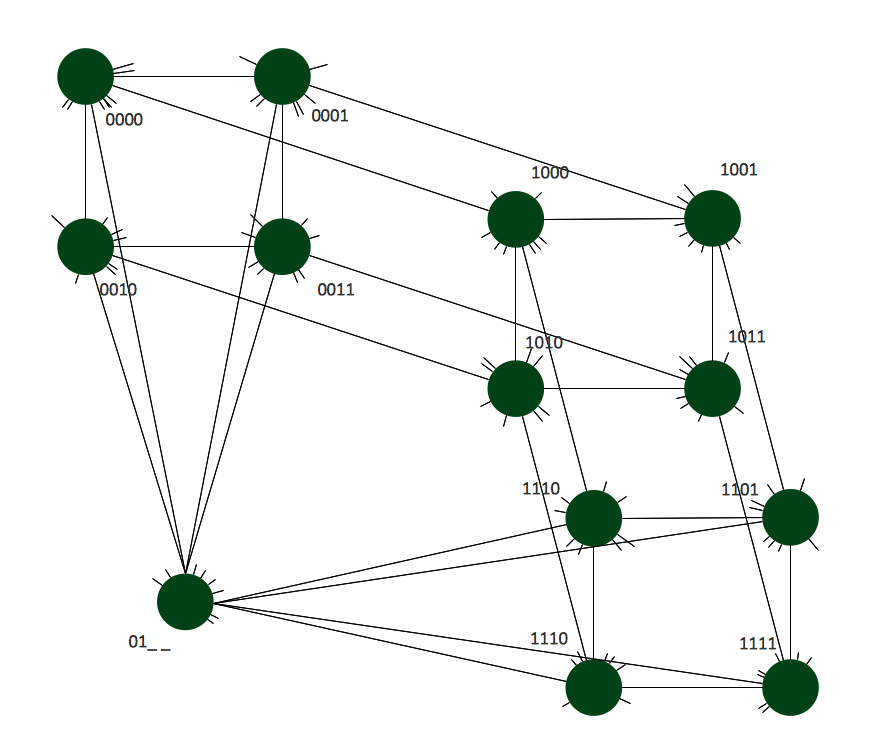
Example 1. Hypercube Network Topology
This sample shows the Hypercube network topology.
Network topology is the topological structure of the computer network.
Hypercube is a type of the toroidal network. The Torus is a topology with n-dimensional grid network with circularly connection of the nodes. If the number of nodes along each dimension of the toroidal network is 2, it is a Hypercube network topology.
Using the predesigned objects, templates and samples of the Computer and Networks Solution for ConceptDraw DIAGRAM you can create your own professional Computer Network Diagrams quick and easy.
The Computer Network Diagrams produced with ConceptDraw DIAGRAM are vector graphic documents and are available for reviewing, modifying, and converting to a variety of formats (image, HTML, PDF file, MS PowerPoint Presentation, Adobe Flash or MS Visio).
See also Samples:
NINE RELATED HOW TO's:
The grid network topology is a type of the network topology in which the each node of the network is connected with two neighboring nodes along one or more dimensions. If the chain of nodes has the circular form and the network is one-dimensional, the topology is named the Ring. The topology with n-dimensional grid network with circularly connection of the nodes is named the Torus.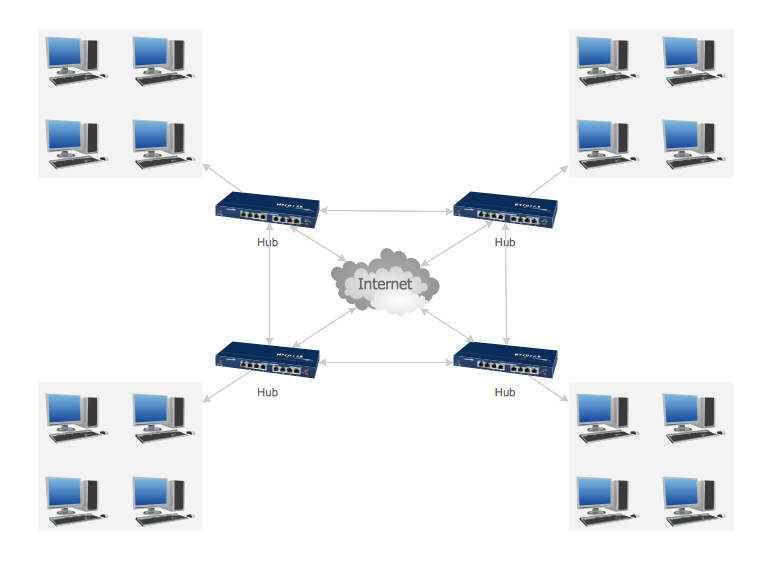
Picture: Grid Network Topology
Related Solution:
When describing any computer network, we imagine a set of devices and nodes, arranged in some way. Talking about network structures, we should distinguish physical and logical network topologies, as physical topology is about devices location and logical topology illustrates data flow. In the same time, they do not have to match, and some devices, such as repeaters, may have a physical star layout, but a bus logical topology.
There are two main types of computer network topologies: Physical topology that show the physical organization of a network - equipment and types of connections. Star network topology involves a set of devices that is connected to a single hub (router). Ring network topology means that, devices connected according this topology have two connections, connecting with nearby devices to make a loop. Bus network topology is the topology presented at the current diagram. It is similar to a ring topology. The difference is that data moves up and down a linear connection, copying itself where network equipment works as bus-stations along the way. This network topology can be used for small network, or when adding an extra device into a network.
Picture: Network Topologies
Related Solution:
Another stencil library that is included in the Computer Network Diagrams solution is the “Computer Network” one. It includes such design symbols as the representation of the Desktop computer, HP desktop computer, Workstation, HP workstation, iMac, HP laptop, Fujitsu laptop, MacBook, MacBook Air, MacBook Pro, Computer monitor, Apple Thunderbolt Display, Mac Pro, iPad mini, iPhone 4, iPhone 5, iPhone / iPod Touch, iPod Classic, PDA, Smartphone, Mobile Phone, Mainframe, City, Satellite dish, Radio tower, Satellite, Cloud, Data store, Compact disk, Curved bus, Comm-disk, Token-ring, FDDI Ring, Star, Ethernet and bus.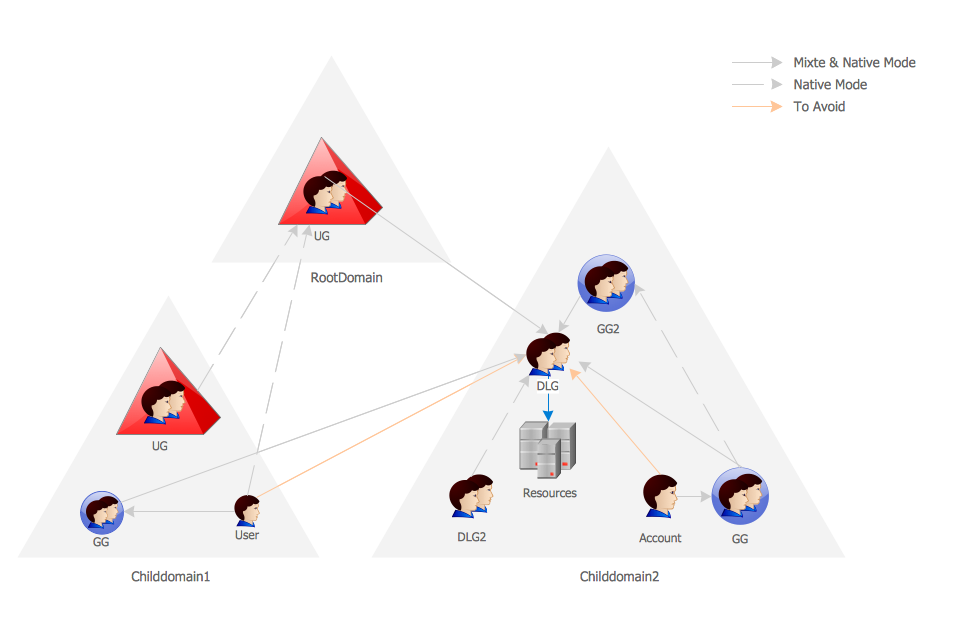
Picture: Active Directory Network. Computer and Network Examples
Related Solution:
If you have a small budget to design a computer network, you have to be very careful. One of the most cheap technologies to implement is a bus network topology, however it has many disadvantages. For instance, if the network cable is somehow damaged, the entire network won't work.
This diagram illustrates a so-called "Bus" network topology. This type of network arrangement means that each computer or other device is linked to a main link (bus). The end nodes are shown as a circle. The links to the bus are depicted as solid vertical lines. The bus is shown as a bold horizontal line. This diagram can serve as a template for creating logical or physical network diagrams. The set of vector libraries supplied with ConceptDraw Computer and Networks solution contains the symbols of all LAN and WLAN elements required for creating network diagrams of any configuration.
Picture: Bus Network Topology
Related Solution:
When describing any computer network, we imagine a set of devices and nodes, arranged in some way. Talking about network structures, we should distinguish physical and logical network topologies, as physical topology is about devices location and logical topology illustrates data flow. In the same time, they do not have to match, and some devices, such as repeaters, may have a physical star layout, but a bus logical topology.
There are two main types of computer network topologies: Physical topology that show the physical organization of a network - equipment and types of connections. Star network topology involves a set of devices that is connected to a single hub (router). Ring network topology means that, devices connected according this topology have two connections, connecting with nearby devices to make a loop. Bus network topology is the topology presented at the current diagram. It is similar to a ring topology. The difference is that data moves up and down a linear connection, copying itself where network equipment works as bus-stations along the way. This network topology can be used for small network, or when adding an extra device into a network.Picture: Network Topologies
Related Solution:
When deciding to start your own business, you have to take into account a bunch of different aspects. One of the ways to get inspired is to look through various restaurant floor plans samples or interior photos of already known establishments. This will help you, but keep in mind that a really unforgettable establishment must be unique.
This restaurant floor plan diagram was designed using ConceptDraw Cafe and Restaurant Floor Plan solution. It can be used as a sample while considering a custom restaurant design. With the help of this example you can estimate the amount of furniture best for a dining room or kitchen of the restaurant. In addition, this plan would be useful as a check list when you will consider a list of the furniture and equipment needed for all areas of the future restaurant.
Picture: Restaurant Floor Plans Samples
Related Solution:
You can design the Prioritization Matrix by hand on the paper, but we offer you the most easier way — to use the ConceptDraw DIAGRAM diagramming and vector drawing software extended with Seven Management and Planning Tools Solution from the Management Area.
Picture: Prioritization Matrix
Related Solution:
Draw detailed Computer Network Diagrams, Designs, Schematics, and Network Maps with ConceptDraw DIAGRAM in no time! Pre-drawn shapes representing computers, network devices plus smart connectors help create accurate diagrams and documentation.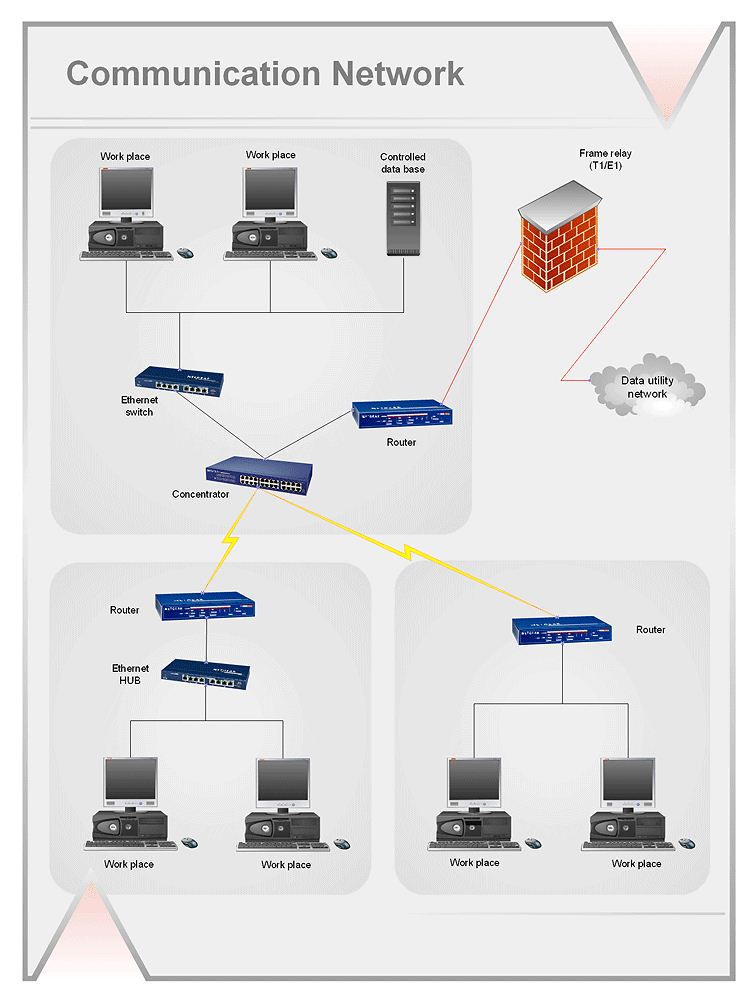
Picture: Network Diagramming with ConceptDraw DIAGRAM
ConceptDraw DIAGRAM is a powerful Network Engineering software thanks to the Vehicular Networking Solution and many other networking solutions from the Computer and Networks Area of ConceptDraw Solution Park.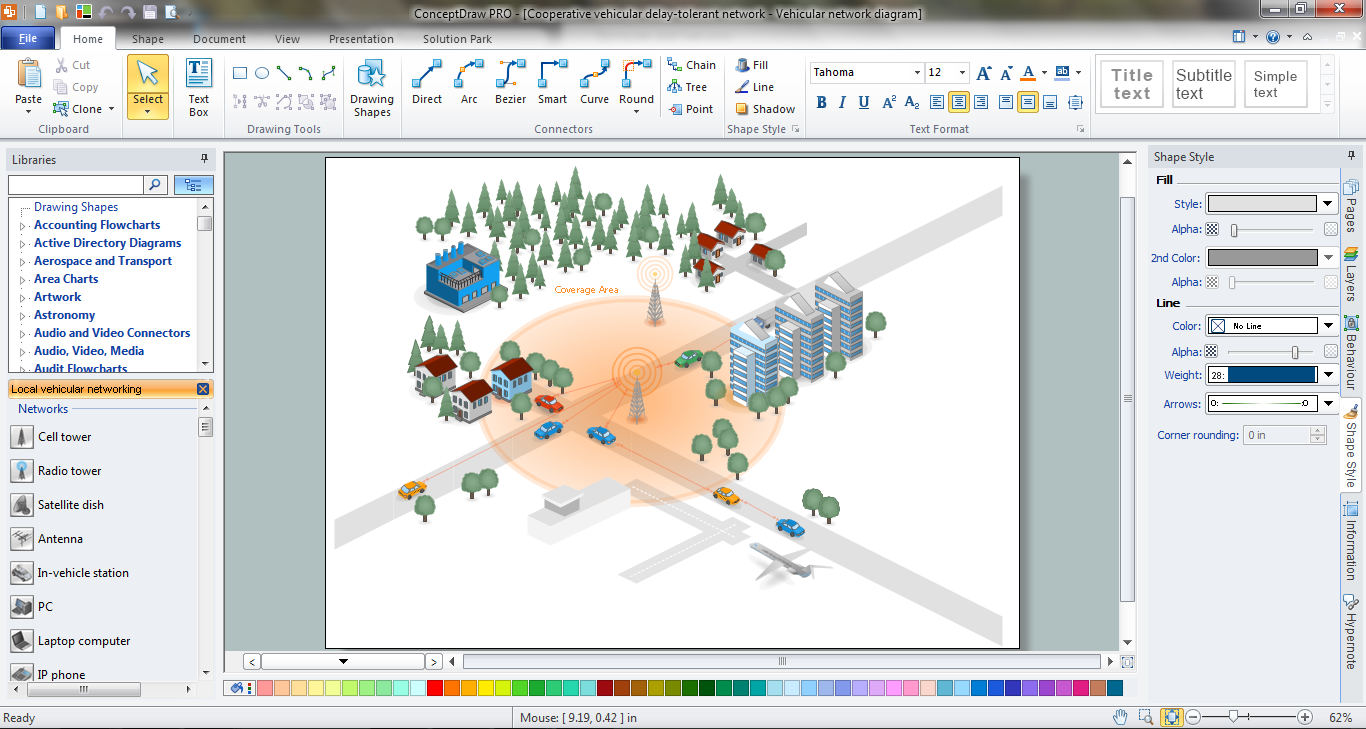
Picture: Network Engineering
Related Solution: