This example of cloud computing system architecture diagram was redesigned from the Wikimedia Commons file: ArchitectureCloudLinksSameSite.png. [commons.wikimedia.org/ wiki/ File:ArchitectureCloudLinksSameSite.png]
"An example showing a grid computing system connecting many personal computers over the Internet using inter-process network communication ...
In computer science, inter-process communication (IPC) is the activity of sharing data across multiple and commonly specialized processes using communication protocols. Typically, applications using IPC are categorized as clients and servers, where the client requests data and the server responds to client requests." [en.wikipedia.org/ wiki/ Inter-process_ communication]
"Grid computing is the collection of computer resources from multiple locations to reach a common goal. The grid can be thought of as a distributed system with non-interactive workloads that involve a large number of files. Grid computing is distinguished from conventional high performance computing systems such as cluster computing in that grid computers have each node set to perform a different task/ application. Grid computers also tend to be more heterogeneous and geographically dispersed (thus not physically coupled) than cluster computers." [Grid computing. Wikipedia]
The diagram example "Grid computing system architecture" was created using ConceptDraw PRO diagramming and vector drawing software extended with the Azure Architecture solution from the Computer and Networks area of ConceptDraw Solution Park.
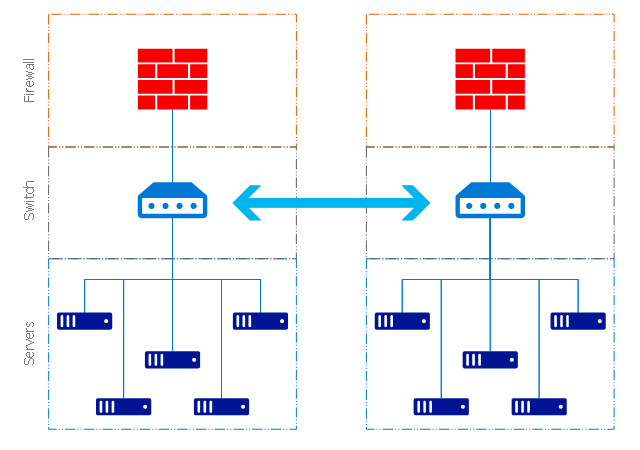
Grid computing system architecture diagram
 Azure Architecture
Azure Architecture solution bundles into one handy tool everything you need to create effective Azure Architecture diagrams. It adds the extra value to versatile ConceptDraw PRO software and extends the users capabilities with comprehensive collection of Microsoft Azure themed graphics, logos, preset templates, wide array of predesigned vector symbols that covers the subjects such as Azure management, Azure storage, and Azure services, amongst others, and allow you to illustrate Azure Architecture diagrams at any degree of complexity, to present visually your Azure cloud system architecture with professional style, to design Azure cloud topology, to document Windows Azure Architecture and Azure Cloud System Architecture, to visualize the great abilities and work of Microsoft Azure Cloud System and Azure services.
 Bubble Diagrams
Bubble diagrams have enjoyed great success in software engineering, architecture, economics, medicine, landscape design, scientific and educational process, for ideas organization during brainstorming, for making business illustrations, presentations, planning, design, and strategy development. They are popular because of their simplicity and their powerful visual communication attributes.
 Seven Basic Tools of Quality
Manage quality control in the workplace, using fishbone diagrams, flowcharts, Pareto charts and histograms, provided by the Seven Basic Tools of Quality solution.
 Website Wireframe
The innovative Website Wireframe solution enhances the ConceptDraw PRO v10 functionality with newest wireframe tools, libraries with variety of predesigned icons, symbols, buttons, graphics, forms, boxes, and many other vector elements, templates and professionally designed samples, which make it the best wireframing software. Website Wireframe solution gives you significant advantages when designing and maintaining websites, creating skeletal and content-free depictions of website structure, making website prototypes and planning the content arrangement before committing to design, also speeds up the processes of sketching, producing and sharing wireframe examples of website style and interface design.
HelpDesk
How to Add a Block Diagram to a PowerPoint Presentation Using ConceptDraw PRO

 Computer and Network Package
Computer and Network Package is a large set of valuable graphical solutions from ConceptDraw Solution Park, developed and specially selected to help computer network specialists and IT professionals to realize their daily work the most efficiently and quickly. This package contains extensive set of graphic design tools, ready-to-use vector elements, built-in templates and samples for designing professional-looking diagrams, charts, schematics and infographics in a field of computer network technologies, cloud computing, vehicular networking, wireless networking, ensuring networks security and networks protection. It is useful for designing different floor plans and layout plans for homes, offices, hotels and instantly construction detailed schemes of computer networks and wireless networks on them, for making professional-looking and colorful Pie Charts, Bar Graphs and Line Charts visualizing the relevant information and data.
 Telecommunication Network Diagrams
Telecommunication Network Diagrams solution extends ConceptDraw PRO software with samples, templates, and great collection of vector stencils to help the specialists in a field of networks and telecommunications, as well as other users to create Computer systems networking and Telecommunication network diagrams for various fields, to organize the work of call centers, to design the GPRS networks and GPS navigational systems, mobile, satellite and hybrid communication networks, to construct the mobile TV networks and wireless broadband networks.
- Cloud Computing Architecture Diagrams | Grid computing system ...
- Grid Computing Architecture Diagram With Explanation
- Grid computing system architecture | Basic Flowchart Symbols and ...
- Grid Computing Architecture Diagram
- Diagram Of Grid Computing
- Grid Computing With Diagram
- Diagram Of Grid Architecture
- Grid Computing Block Diagram
- Block Diagram Of Grid In Grid And Cloud Computing
- Diagram Block Grid Computing
- Grid computing system architecture | Basic Flowchart Symbols and ...
- Diagram For Grid Architecture
- Grid Network Topology | Grid computing system architecture ...
- Cloud Computing Architecture Diagrams | How to Draw a Computer ...
- How to Draw a Computer Network Diagrams | Cloud Computing ...
- Enterprise Architecture Diagrams | Grid computing system ...
- Cloud Computing Architecture Diagrams | Cisco IBM. Cisco icons ...
- Grid Network Topology | Data Flow Diagram Software | Azure ...
- Grid Architecture For Diagram