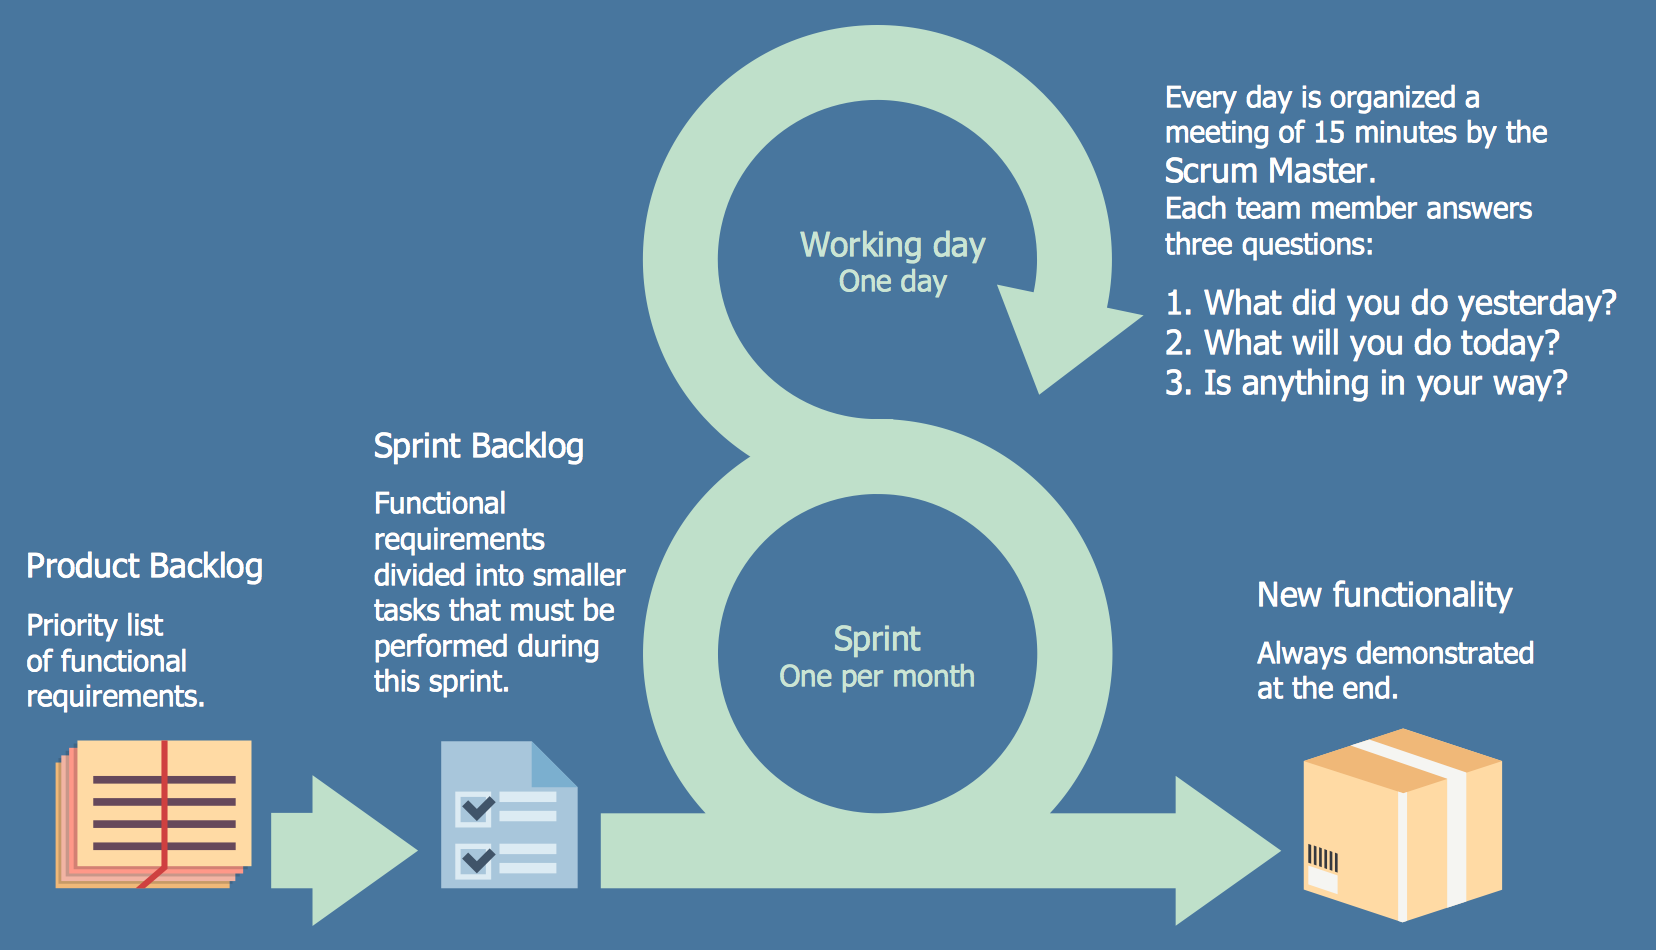
Scrum workflow
Agile Methodology

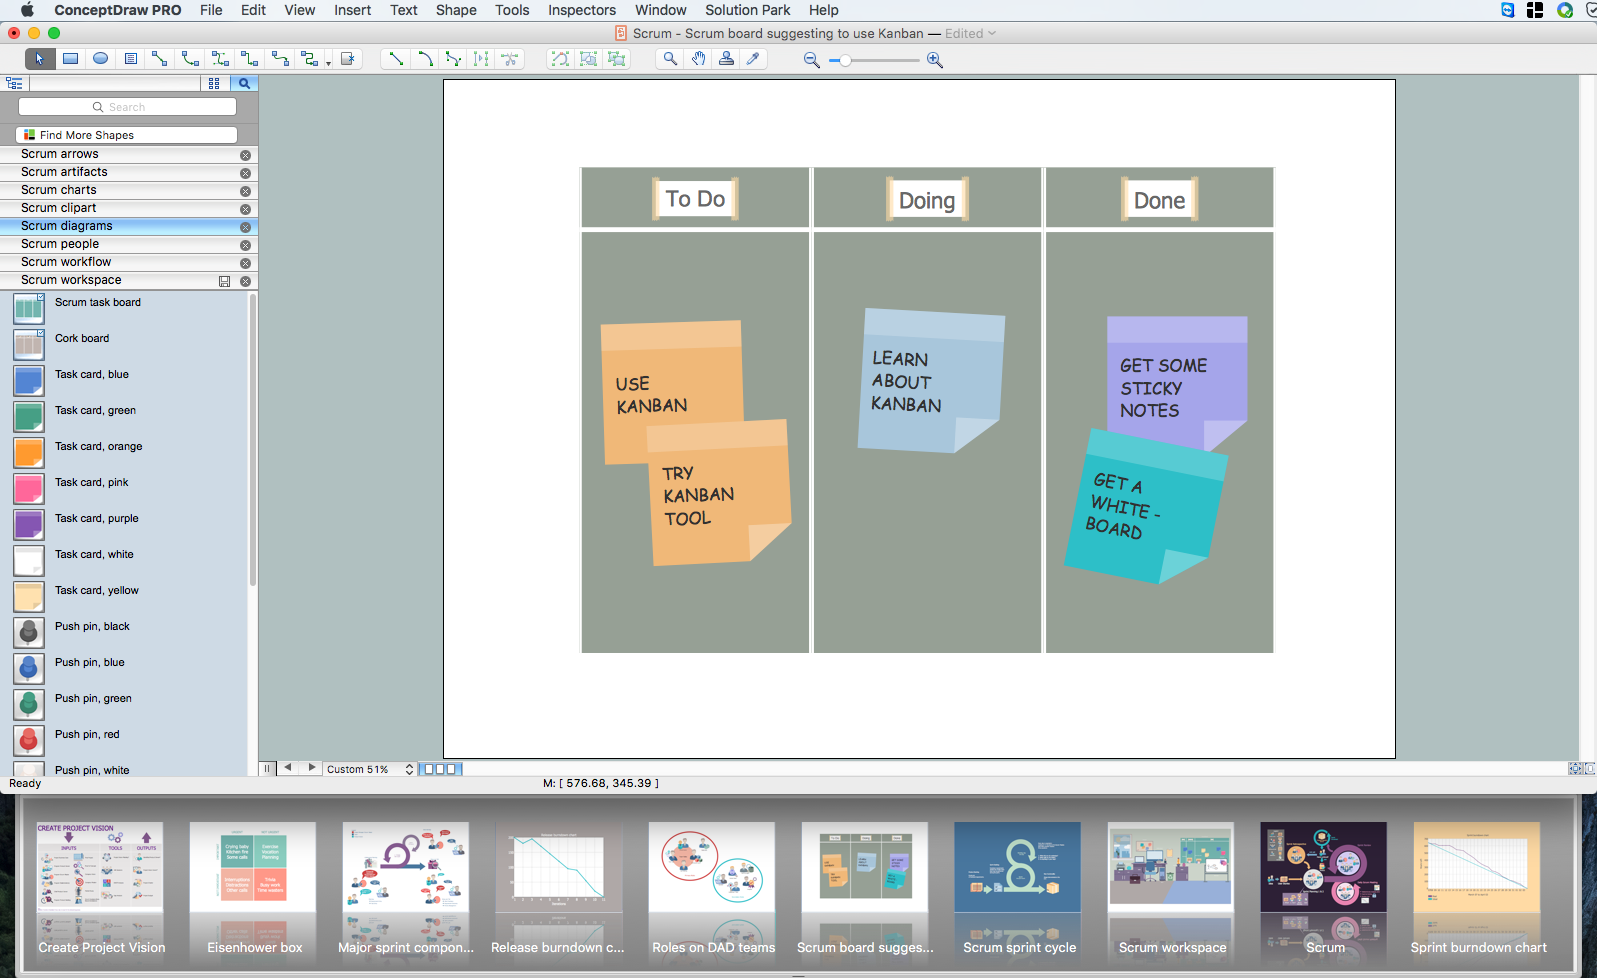
Scrum board
Scrum process work items and workflow

Scrum

SSADM Diagram

 Project Management Area
Project Management area provides Toolbox solutions to support solving issues related to planning, tracking, milestones, events, resource usage, and other typical project management functions.
 ConceptDraw Solution Park
ConceptDraw Solution Park collects graphic extensions, examples and learning materials
HelpDesk
How to Create a Release Burn-Down Chart

UML Diagram

 Venn Diagrams
Venn Diagrams are actively used to illustrate simple set relationships in set theory and probability theory, logic and statistics, mathematics and computer science, linguistics, sociology, and marketing. Venn Diagrams are also often used to visually summarize the status and future viability of a project.
 Seven Basic Tools of Quality
Manage quality control in the workplace, using fishbone diagrams, flowcharts, Pareto charts and histograms, provided by the Seven Basic Tools of Quality solution.
 Value Stream Mapping
Value stream mapping solution extends ConceptDraw DIAGRAM software with templates, samples and vector stencils for drawing the Value Stream Maps (VSM) in lean manufacturing practice.
- Agile Methodology | PM Agile | Scrum Workflow | What Is Agile ...
- Agile Methodology | Scrum process work items and workflow ...
- PM Agile | Agile Methodology | Scrum Workflow | What Is Scrum In ...
- PM Agile | Scrum process work items and workflow | How to Create ...
- PM Agile | Scrum Workflow | Scrum | Scrum Management
- Scrum Workflow | Scrum | PM Agile | Project Management With Scrum
- PM Agile | Scrum Workflow | Scrum process work items and ...
- PM Agile | Program Evaluation and Review Technique (PERT) with ...
- Conceptdraw.com: Mind Map Software , Drawing Tools | Project ...
- PM Meetings | A Tool for EffectiveTeam Meetings | Tool for ...
- A Tool for EffectiveTeam Meetings | PM Meetings | How To ...
- Anyone Have an ERD Symbols Quick Reference? | AWS ...
- PM Agile | What are Infographic Area | Aerospace and Transport ...
- Think. Act. Accomplish. | How To Use Skype for Business | PM Agile ...
- Group Collaboration Software | Collaboration Area | PM Agile ...
- PM Easy | Gantt Chart Software | PM Dashboards | Project Tracking ...
- Think and act effectively | Exercise your brain | PM Agile ...
- Create a Presentation Using a Design Template | Quality Mind Map ...
- PM Response | Project Exchange | PM Agile | Agile Development ...
- Bank Sequence Diagram | Sequence Diagram Tool | UML ...