This site uses cookies. By continuing to browse the ConceptDraw site you are agreeing to our Use of Site Cookies.

UML Class Diagram Generalization Example UML Diagrams

This sample was created in ConceptDraw DIAGRAM diagramming and vector drawing software using the UML Class Diagram library of the Rapid UML Solution from the Software Development area of ConceptDraw Solution Park.
This sample describes the use of the classes, the generalization associations between them, the multiplicity of associations and constraints. Provided UML diagram is one of the examples set that are part of Rapid UML solution.

How to Create a Pie Chart

Create a Pie Chart with ConceptDraw software quickly and easily. The simple tutorial helps you learn how to create a pie chart.

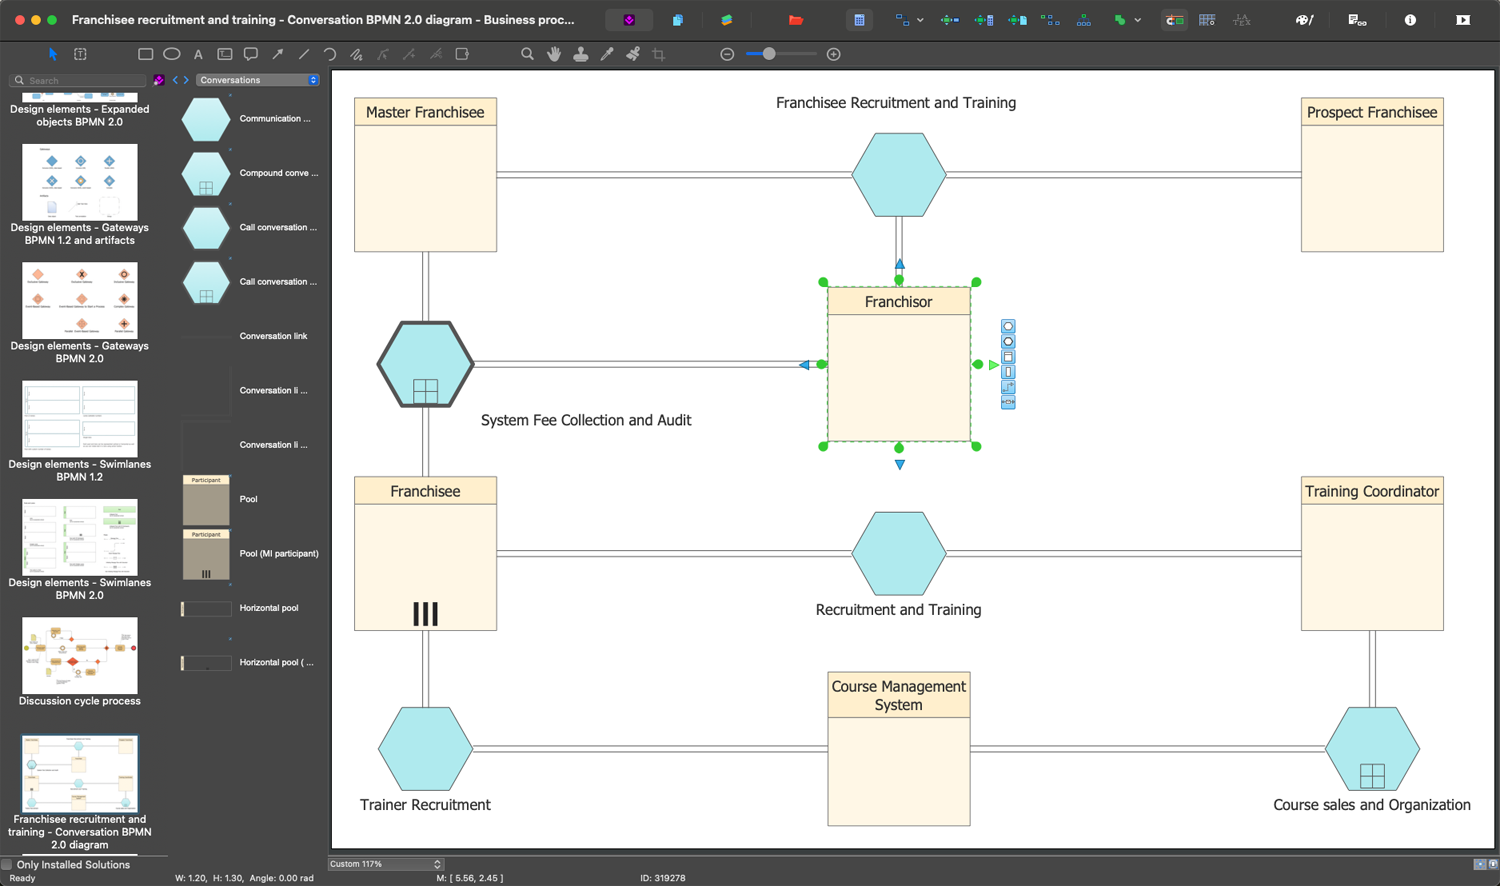
The Best Business Process Modeling Software

ConceptDraw DIAGRAM is a best business processes modeling software for graphical documenting processes of the company.
ConceptDraw has 142 vector stencils in the 8 libraries that helps you to start using Diagramming Software for designing own Business Process Diagrams.
The vector stencils library "Advertising" contains 8 marketing communication icons.
Use it to design your business and finance illustrations and infographics with ConceptDraw PRO diagramming and vector drawing software.
"Advertising is a form of marketing communication used to promote or sell something, usually a business's product or service. Advertising by a government in favor of its own policies is often called propaganda." [Advertising. Wikipedia]
The icon set example "Design elements - Advertising" is included in the Business and Finance solution from Illustration area of ConceptDraw Solution Park.
Icon set
Icon set, spam, online advertising, mobile advertising, marketing agent, advertising board, advertising agency, advertising, ads paper,

Entity Relationship Diagram Examples

Creating an entity-relationship (ER) model is to visually represent the structure of a business database, where data equates to entities (or objects) that are linked by defined relationships expressing dependencies and requirements. By nature it is an abstract visualization, the first step in the design process towards creating a logical and functional database.
ConceptDraw gives the ability to describe a database using the Entity-Relationship model. Entity-Relationship Diagram solution includes icons advocated by Chen's and Crow’s Foot notation that can be used when describing a database.
How to Build an Entity Relationship Diagram (ERD)

Accounting Flowchart Symbols

If you deal everyday with accounting procedures, you might come to that point when you have to draw an accounting flowchart mentioning all the necessary details for getting the right result and in order to succeed in your field of business activity. Making it is truly simple in case you have ConceptDraw DIAGRAM which is a unique software that allows you to create any kinds of charts and flowcharts as well as schemes, diagrams and plans. This product is so special that once you start using it, you will understand the way it works quick and will never need any other software for the purpose of creating all mentioned above to see as a result incredible, smart, professional, sophisticated flowchart.

How to Create a Line Chart

Create a Line Chart with ConceptDraw using our tips. Here you can find an explanation of how to create a line chart quickly.

How to Create a Column Chart

The question how to create a column chart have a simple answer. Use ConceptDraw tips to find out how to create a column chart depicts your data the best way.

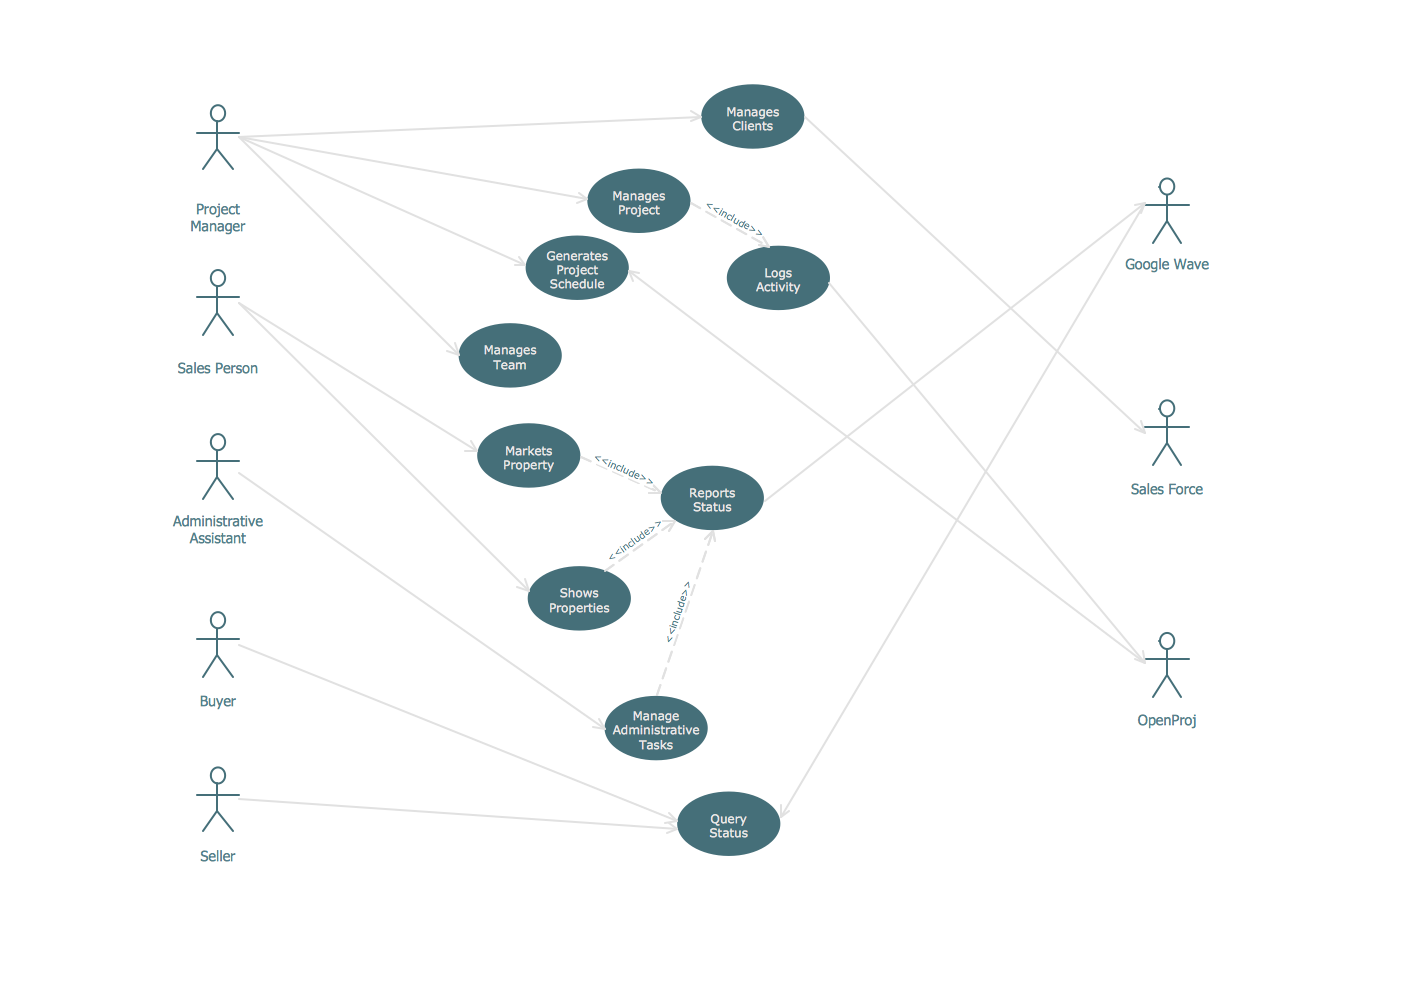
UML Use Case Diagram Example - Estate Agency

UML Diagram Estate Agency. This sample was created in ConceptDraw DIAGRAM diagramming and vector drawing software using the UML Use Case Diagram library of the Rapid UML Solution from the Software Development area of ConceptDraw Solution Park.
This sample shows the work of the estate agency and is used by the estate agencies, building companies, at the trainings of the estate agencies, for understanding the working processes of the estate agencies.

Business Process Flowchart Symbols

The business process flowchart symbols used for business process mapping are predefined by Business Process Modeling Notation (BPMN) and actually have their roots in the data processing diagrams and programming flow charts. Business Process flowchart symbols provide drawing business process flowcharts, diagrams and maps of any complexity.