Total Quality Management Value
The Total quality management (TQM) is an enterprise-wide method of continuous quality improvement of all organizational processes, including the enhancement of ability to deliver high-quality products and services to the customers. The TQM includes eight main elements, which have great value: customer-focused, process-centered, total employee involvement, integrated system, continual improvement, strategic and systematic approach, fact-based decision making, communications. ConceptDraw PRO diagramming and vector drawing software offers the Total Quality Management Diagram solution with effective drawing tools, predesigned vector elements, samples and templates that help easy design the Total Quality Management diagrams, TQM flowcharts and Mind Maps widely used in quality management projects to visualize the business processes and industrial processes for your organization, to demonstrate the quality control step-by-step in a visual manner, to compare visually the ideal and real stages of processes.Organizational Structure Total Quality Management
The Total Quality Management Diagram solution helps you and your organization visualize business and industrial processes. Create Total Quality Management diagrams for business process with ConceptDraw software.Quality Management Teams
ConceptDraw MINDMAP with Quality mindmaps solution as a demonstration of the creative approach to quality management in daily work of quality management team.Quality Management Tools
ConceptDraw PRO diagramming and vector drawing software offers at your disposal quality management tools of the Total Quality Management (TQM) Diagrams solution from the Quality area of ConceptDraw Solution Park which will help facilitate a drawing diagrams process for quality management.Quality Management System
ConceptDraw PRO diagramming and vector drawing software extended with Total Quality Management (TQM) Diagrams solution from the Quality area of ConceptDraw Solution Park perfectly suits for development and visually representing a Quality Management System.Total Quality Management with ConceptDraw
Total Quality Management (TQM) system is the management method where the confidence in quality of all organization processes is placed foremost. The given method is widely used in production, in educational system, in government organizations and so on.Product Proposal Template
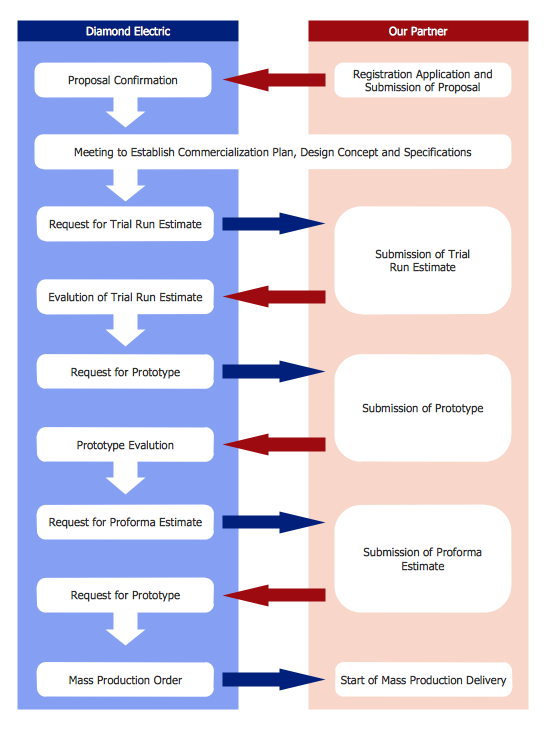
This template was created in ConceptDraw PRO diagramming and vector drawing software using the Block Diagrams Solution from the “Diagrams” area of ConceptDraw Solution Park. This template shows the Product Proposal Diagram on that is displayed the sequence of the product planning steps. This diagram is convenient, visual and clear.What is Gantt Chart (historical reference)
Historical reference about the Gantt chart.SWOT Analysis Solution - Strategy Tools
The condition and successful development of the company depends on how efficiently it is able to react on different outside influences. Analysis and interrelated consideration of external factors and the company's capabilities allow effectively solve appearing problems. One of the most common methods of evaluation together internal and external factors influencing the company's development is SWOT analysis elaborated for business and industry. It is a necessary element of researches and obligatory preliminary stage at the preparation of strategic and marketing plans of the company. Upon the results of SWOT analysis, we can assess does the company have the internal forces and resources to realize the existing opportunities and resist external threats, and what internal deficiencies require the prompt rectification. ConceptDraw PRO software enhanced with SWOT Analysis solution offers powerful drawing and strategy tools for effective execution the SWOT and TOWS analysis for your company with a goal of effectively realizing strategic planning and correct decision-making.Swim Lane Diagrams
Swim Lane Diagrams are the kind of process flow diagrams and effective tool for documenting the business processes required for any business company for its productive work, for easy defining the weak points, reasons of defects, or delays during the process. Swim Lane Diagram is based on the IDEF3 standard and was developed primarily for using in projecting. Its name derives from the use of horizontal or vertical lanes. The blocks that denote the parts of the processes are arranged within definite lanes according to the belonging to responsible worker. So the process of any complexity is visually divided into the parts and represented with indication the responsibility for execution of each part. This significantly facilitates the comprehension of its work. Use the ConceptDraw PRO software and predesigned vector objects from the Swim Lanes library of Business Process Mapping Solution included to ConceptDraw Solution Park to easy develop Swim Lanes Flowcharts and Diagrams, for modeling and documenting the business processes in a simple and visual graphic form.SWOT Analysis Tool for Small Business
SWOT analysis is effective method of making the plan to evaluate the Strengths, Weaknesses, Opportunities, and Threats involved in a project. SWOT analysis includes the specifying project objectives and attentive identifying the internal and external causes for accomplishing the main project goals. It is actively used in large and small business project management for effective and clear identifying the critical factors. SWOT and TOWS Matrix Diagrams solution is included to ConceptDraw Solution Park and contains the high-quality analysis tools. This graphical solution turns the ConceptDraw PRO software in an excellent marketing management and advertising agency software, the best SWOT analysis tool for small business or large, as you like and need. Included graphic tools, visual and project planning components make it the best marketing project management software for marketing project planning and for making marketing presentations. Use the ConceptDraw PRO to create professional and well-designed SWOT matrices in minutes.Workflow Diagram
Workflow diagram is a perfect tool to represent visually a repeatable pattern of organizational activity that is powered by resources and to describe in details the transferring of data, documents or tasks during a work process. It effectively explains and documents the process flow that exists and that requires the studying, analyzing and execution. Workflow diagrams help to represent the working processes in a simple visual manner, to follow easy the path of a task in a workflow, to identify the persons responsible for the execution of each stage, to show the accompanied documents and needed resources. All this helps to optimize the workflow and to discover its weak points. Workflow diagrams are mainly designed and used as a part of project documentation, certification process and company policies to comply the standards. To design professionally the Workflow diagrams, use the ConceptDraw PRO software. Enhanced with Workflow Diagrams solution from the Business Processes area, the ConceptDraw PRO it is a powerful workflow diagram maker.IDEF9 Standard
Use Case Diagrams technology. An effective management of changes is significantly facilitated by way of definition and documenting of business-requirements.Building Drawing Software for Design Office Layout Plan
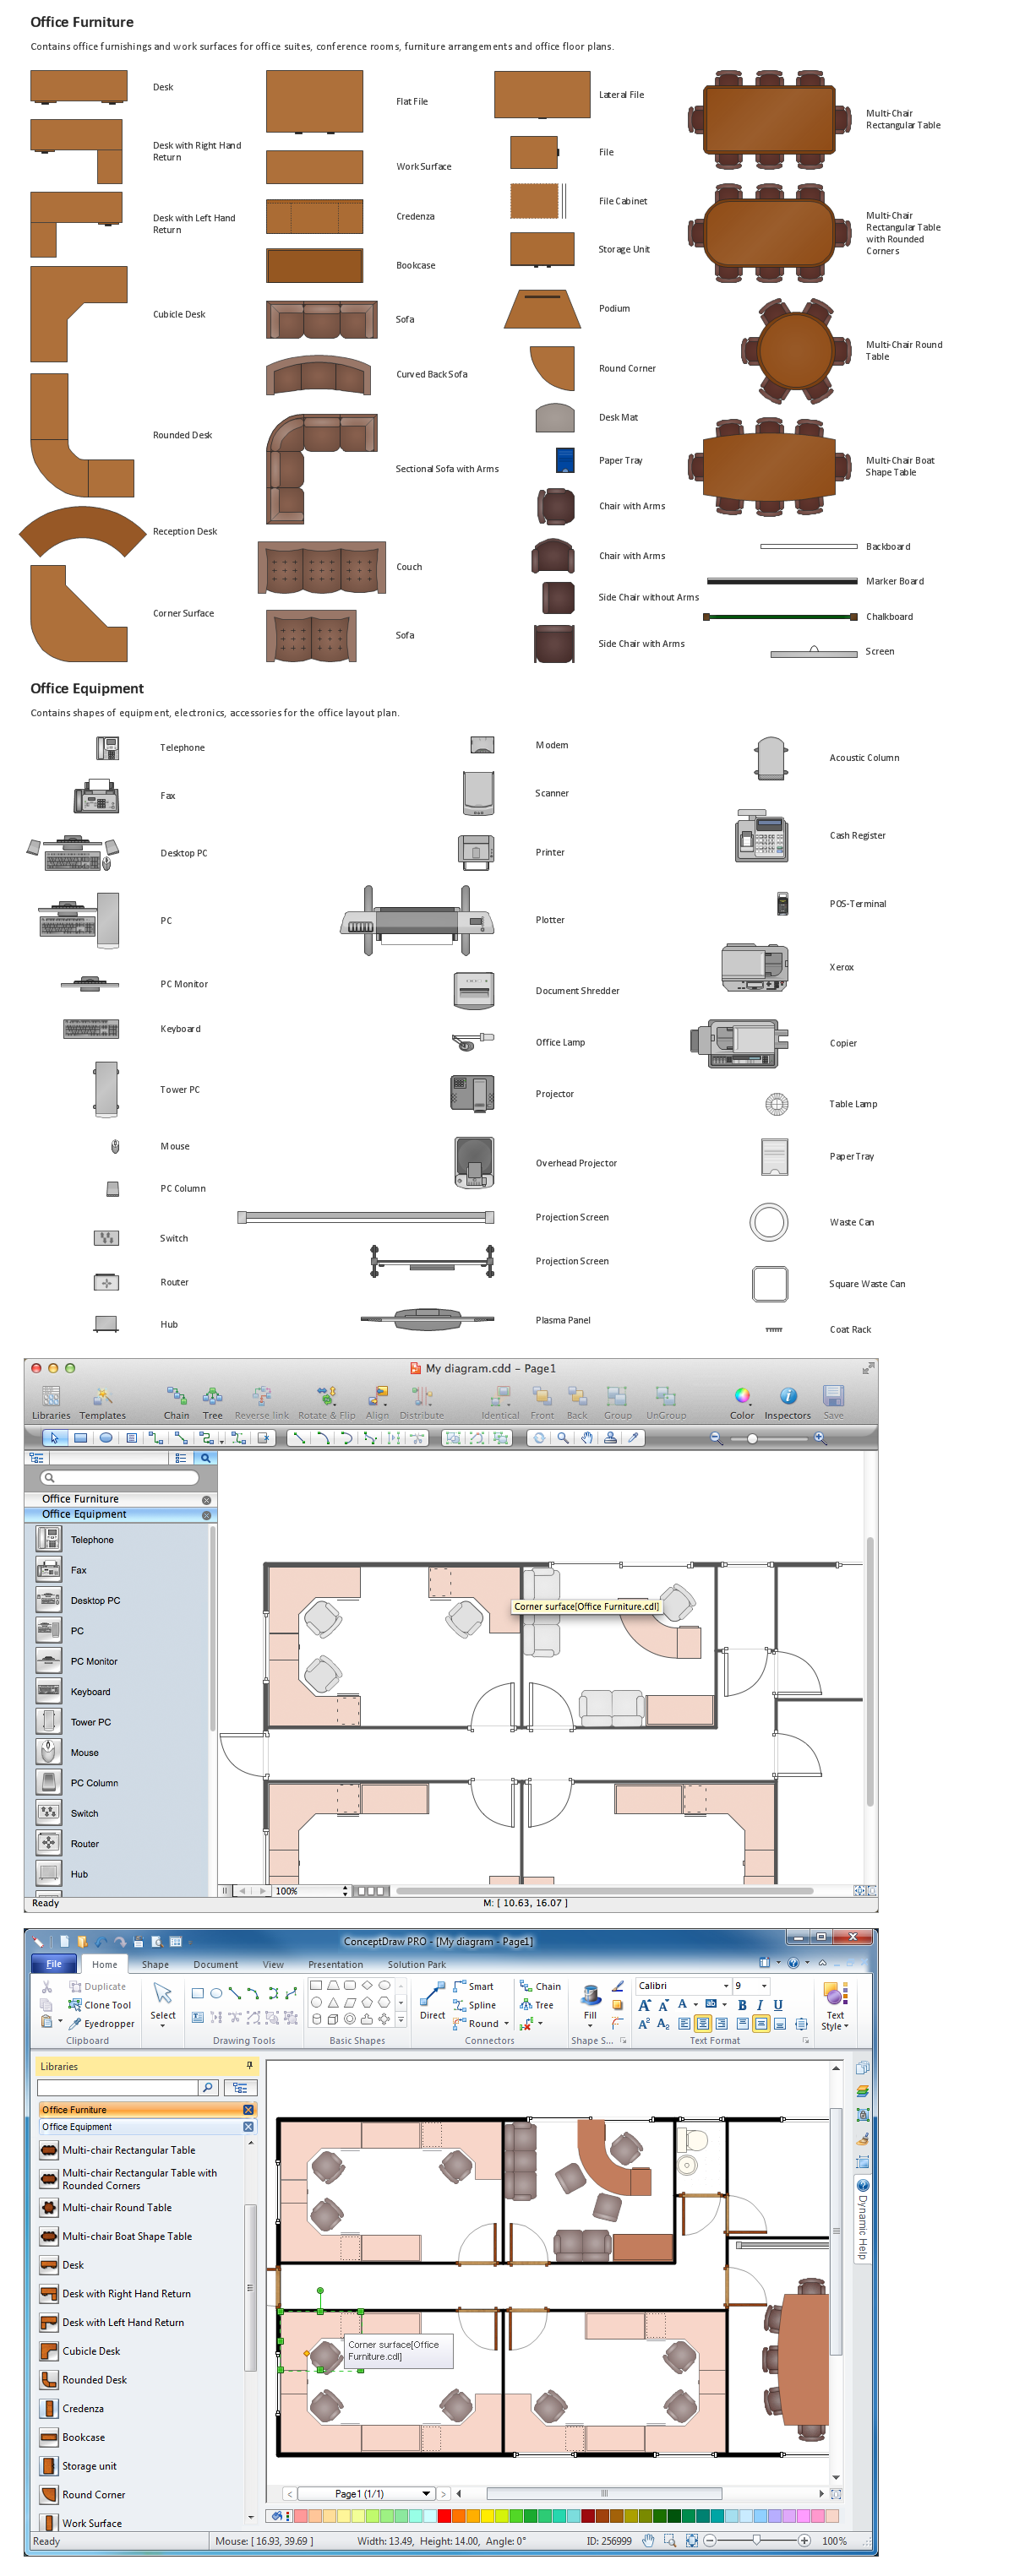
The building plans and blueprints are useful for designing and construction various premises, including definitely offices, small and large office buildings, and whole business centers. Comfort and convenience are the most important for office premises, they let configure on a working mood and increase the work productivity, so the architects and designers need to consider carefully all details. Often their construction on the paper is painstaking and labourious process, which doubly faster and easier to realize with the availability of specialized software, such as ConceptDraw PRO. Design of simple and extensive detailed Office Layout Plans, effective allocation a working space are easily with ConceptDraw PRO powerful vector diagramming and building drawing software tools, and ready-to-use vector design objects. Use they to develop the Office floor plans, Office layout plans, Blueprints for office space planning and furniture placement, Office electrical plans, Office emergency plans, etc. Thought Visio is not available for Mac, there are Visio alternatives which support MS Visio file formats. Try ConceptDraw PRO for both PC and Mac platforms to see its perpetual license privilege .
Using Fishbone Diagrams for Problem Solving
Problems are obstacles and challenges that one should overcome to reach the goal. They are an inseparable part of any business, and the success of an enterprise often depends on ability to solve all problems effectively. The process of problem solving often uses rational approach, helping to find a suitable solution. Using Fishbone Diagrams for Problem Solving is a productive and illustrative tool to identify the most important factors causing the trouble. ConceptDraw PRO extended with Fishbone Diagrams solution from the Management area of ConceptDraw Solution Park is a powerful tool for problem solving with Fishbone Ishikawa diagram graphic method.- Total Quality Management Value | 4m 1e In Tqm
- Total Quality Management Value | Manufacturing 8 Ms fishbone ...
- Total Quality Management Value | 4m 1e
- Total Quality Management Value | Fishbone Diagram | Business ...
- Total Quality Management Value | Office Layout Plans | Fishbone ...
- 4m Quality Method
- 4m In Quality Control
- Total Quality Management Value | Management Principle 4m
- Total Quality Management Value | Fishbone Diagram 4m 1e
- Total Quality Management Value | 4m Principle
- Total Quality Management Value | 4m Fishbone Example
- 4m In The Production
- 4m Quality Control
- 4m Total Quality Management
- Total Quality Management Value | What Are The 4m S Of Quality ...
- Total Quality Management Value
- Total Quality Management Value | Fishbone Diagram | Office Layout ...
- 4m Method
- 4m In Total Quality Management
- Total Quality Management Value


-Diagram-in-SolutionBrowser.png)


