Contoh Flowchart

Maps and Directions

Examples of Flowcharts, Org Charts and More


Network Diagram Software


 Basic Diagramming
This solution extends ConceptDraw DIAGRAM software with the specific tools you need to easily draw flowcharts, block diagrams, histograms, pie charts, divided bar diagrams, line graphs, circular arrows diagrams, Venn diagrams, bubble diagrams and concept maps
Chart Examples

Chart Templates

Network Drawing Software

EPN Frame-Relay and Dial-up Network. Computer and Network Examples

Pyramid Diagram

How to Build a Flowchart

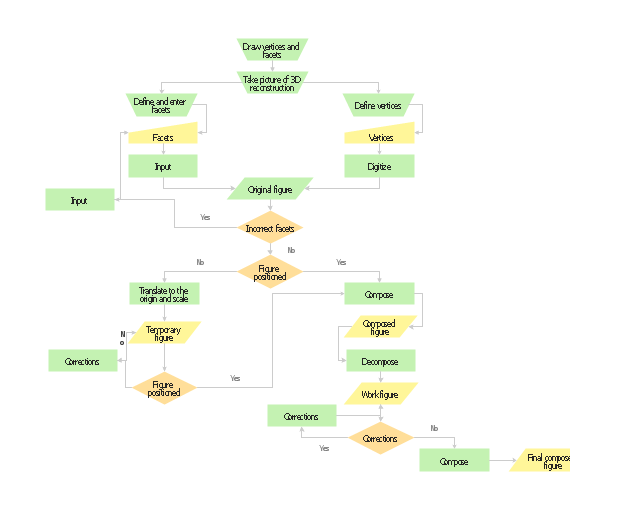
Planning scheme for the construction of a synthetic object.
"Computer-generated imagery (CGI) ... is the application of computer graphics to create or contribute to images in art, printed media, video games, films, television programs, commercials, and simulators. The visual scenes may be dynamic or static, and may be two-dimensional (2D), though the term "CGI" is most commonly used to refer to 3D computer graphics used for creating scenes or special effects in films and television." [Computer-generated imagery. Wikipedia]
The flow chart example "Synthetic object construction" was created using the ConceptDraw PRO diagramming and vector drawing software extended with the Flowcharts solution from the area "What is a Diagram" of ConceptDraw Solution Park.
Flowchart - Synthetic object construction
3D Network Diagram Software

Samples of Flowchart

How to Simplify Flow Charting — Cross-functional Flowchart

Example of DFD for Online Store (Data Flow Diagram)


Flow Diagram

Basic of Flowchart: Meaning and Symbols


Diagrams Mean Nothing

- 3D Network Diagram Software | Pyramid Diagram | | 3d Flowchart ...
- Design elements - 3D directional maps | Process Flowchart | Basic ...
- Process Flow Chart Software Free | Network Icon | 3d Flow Chart Pdf
- Providing telecom services - Cross-functional flowchart | 3D Column ...
- Design elements - 3D directional maps | Process Flowchart | Sign ...
- Near-me area networks (NAN). Computer and Network Examples ...
- HR arrows - Vector stencils library | Turn Arrow 3d
- Process flowchart - Providing telecom services | 3D Column chart ...
- | Software Mapping 3d Work Flow Chart
- Produce Professional Diagrams More Quickly, Easily and Cost ...