3D Network Diagram Software
3D diagrams give more visuality, they are more impressive, attractive, interesting, understandable, and look better than general 2D diagrams. ConceptDraw DIAGRAM supplied with Computer Network Diagrams solution from Computer and Networks area of ConceptDraw Solution Park is a powerful vector-based network diagramming software with useful and convenient tools for drawing 2D and 3D Network Diagrams by both professional engineers and designers, and beginners. Including a lot of predesigned 3D network elements and 3D icons of computer and network devices for customizing your Network diagrams, this solution lets to visually communicate computer networks architecture, topology and design, to simplify and accelerate understanding, analysis and representation, and easily design 3D computer communication network architecture, topology, logic and wiring diagrams, 3D LAN and WAN schematics, drawings and maps. Design easily the 3D diagrams of any types and styles, freely combine the 3D objects in any way you desire.
Pyramid Diagram
Pyramid diagrams help you visualize information as a triangle divided into horizontal slices. Labelled slices represent a hierarchy. Pyramids are used in marketing presentations to show and analyze hierarchy levels. 3D triangular diagram of DIKW pyramid has 6 levels: measurement, facts, data, information, knowledge, wisdom. The data component include different scattered signs or symbols which are merely useless until these random objective facts are somehow processed. Data is a resource which has to be manipulated or rearranged to get useful. Information can be extracted from a pile of data, it also can be mined from different data storages.Pyramid Diagram
The DIKW Pyramid refers loosely to a class of models for representing purported structural and/or functional relationships between data, information, knowledge, and wisdom.Audit Process Flowchart. Audit Flowchart
Audit Process Flowchart, Audit Flowchart - Audit Flowcharts solution for ConceptDraw DIAGRAM Solution Park provides the Audit Flowcharts library with wide variety of predesigned audit flowchart symbols, and also the set of templates and samples allowing you design your own audit flowchart or audit process flowchart in one moment. Simply use any of offered samples and change it for your needs, or fill the desired template.Process Flow Chart Symbols
Process Flow Chart is a visual diagram which shows the processes and relationships between the major components in a system, and uses for this the special process flow chart symbols: special shapes to represent different types of actions and process steps, lines and arrows to represent relationships and sequence of steps. It often named process flow diagram, it use colored flowchart symbols. It is incredibly convenient to use the ConceptDraw DIAGRAM software extended with Flowcharts Solution from the "Diagrams" Area of ConceptDraw Solution Park for designing professional looking Process Flow Charts.Column Chart Software
ConceptDraw Column Chart software allows drawing column charts using predesigned objects or drawing tools. In ConceptDraw Column Chart software you can find a complete set of column chart tools and objects.Pyramid Diagram
A triangular graphic representing Graham's "hierarchy of disagreement", based on Paul Graham's March 2008 essay "How to Disagree".How to Create a Pyramid Diagram
ConceptDraw Pyramid Diagram software allows drawing column charts using predesigned objects or drawing tools. In ConceptDraw Pyramid Diagram software you can find a complete set of column chart tools and objects.Network Diagramming Software for Network Active Directory Diagrams
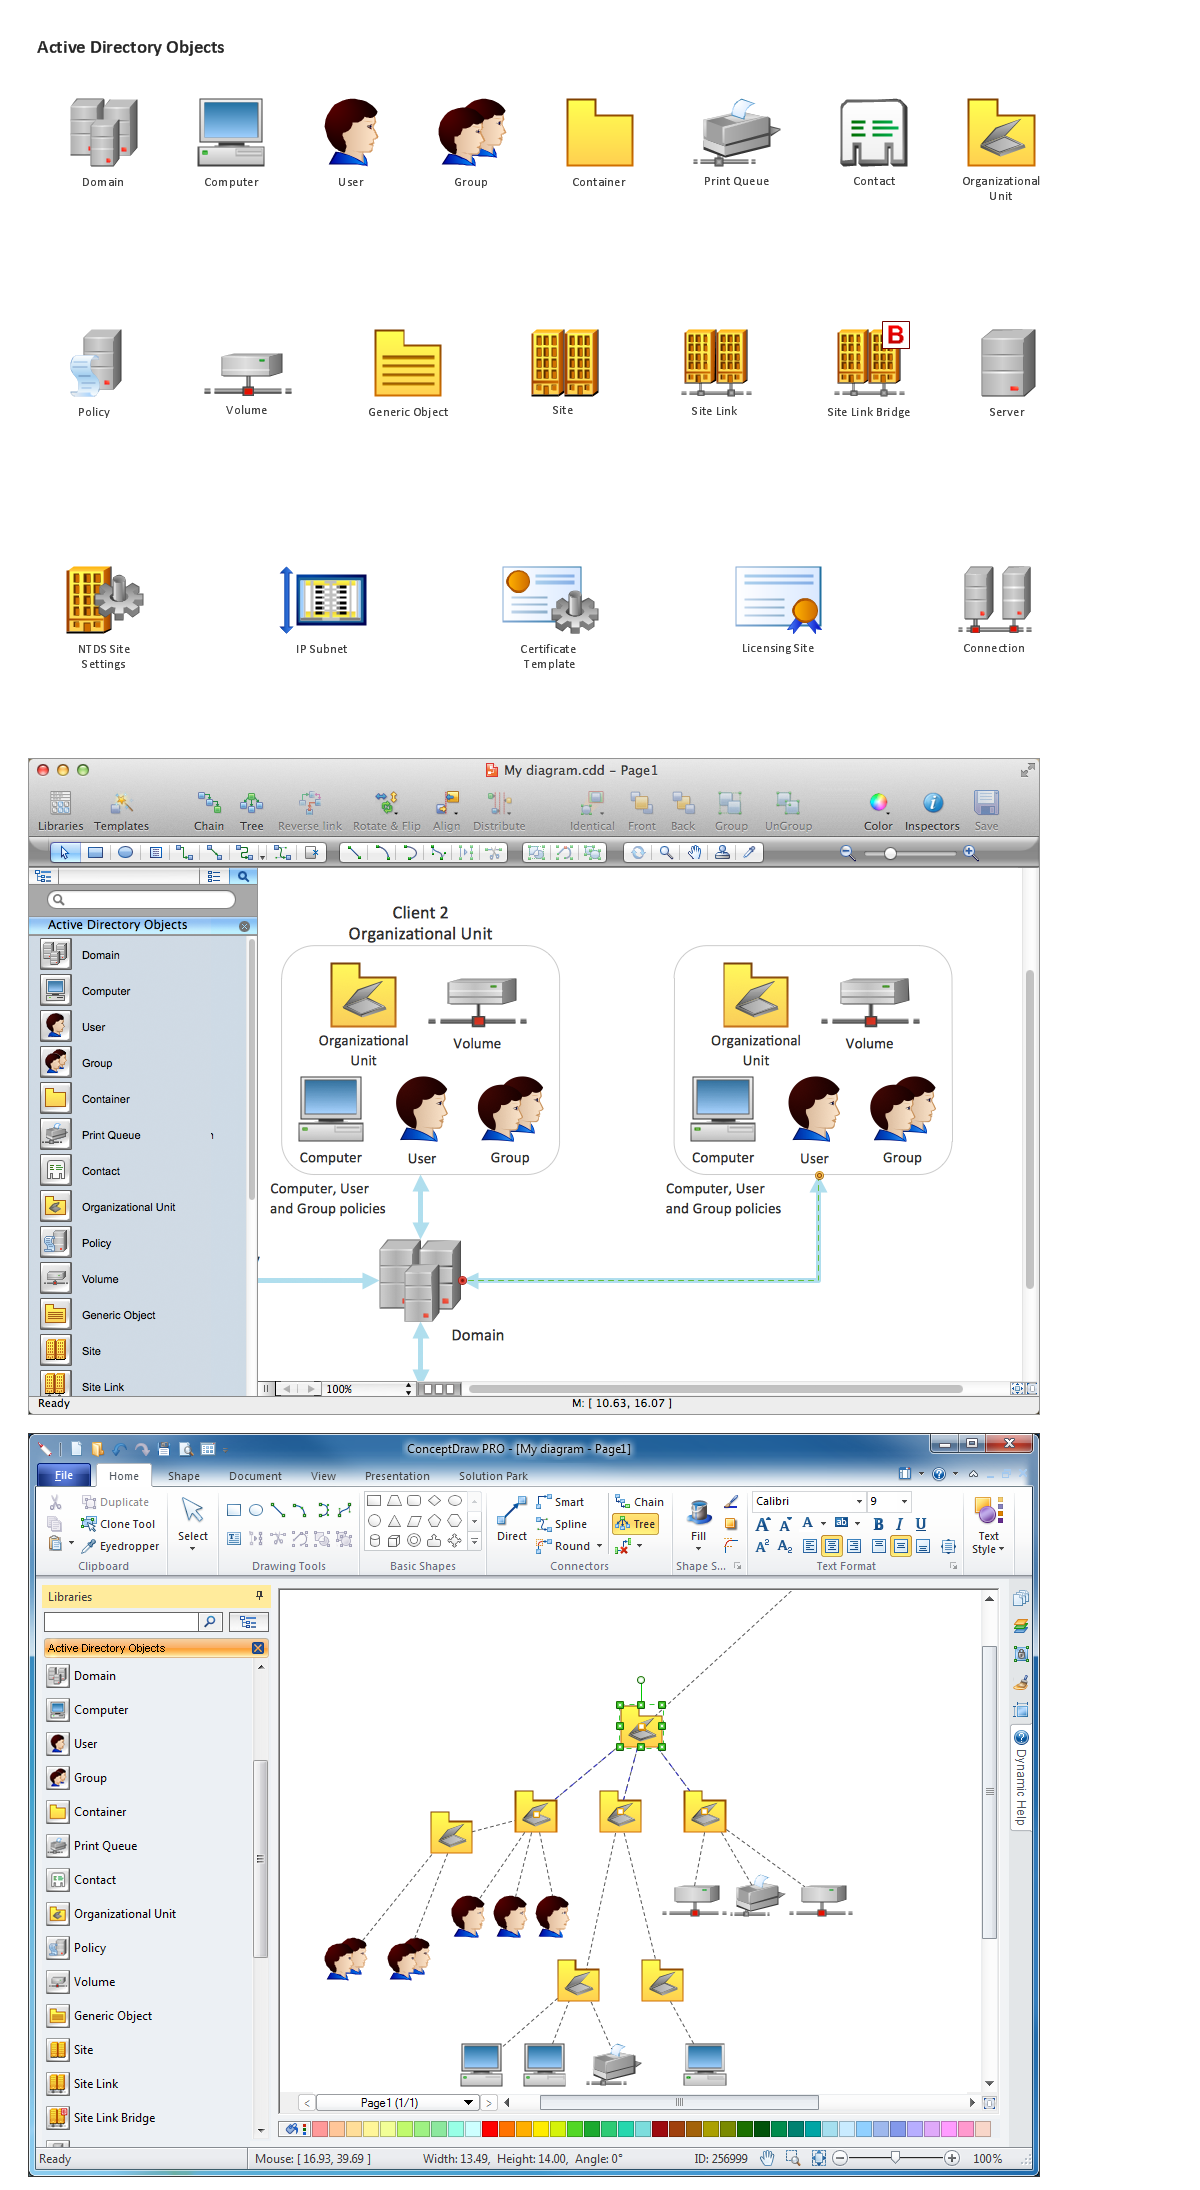
ConceptDraw DIAGRAM is perfect for software designers and software developers who need to draw Network Active Directory Diagrams.
Network Icon
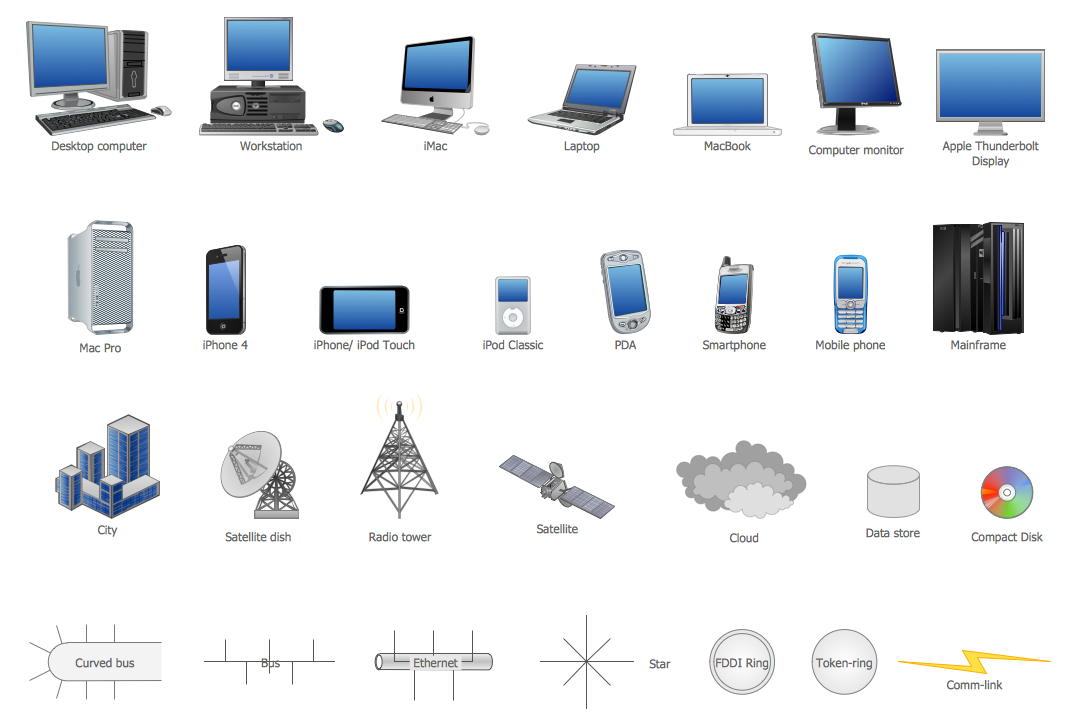
ConceptDraw DIAGRAM diagramming and vector drawing software extended with Computer Network Diagrams Solution from the Computer and Networks Area offers a set of useful tools, collection of templates, samples, and libraries of various computer symbols, computer devices icons, computer network icon for fast and easy drawing network computer diagrams and illustrations.Network Diagram Software. LAN Network Diagrams. Physical Office Network Diagrams
Physical LAN Diagrams illustrate the communication schemes of Local Area Networks, the physical network connection of computers and networks arrangement on the small areas - at homes, offices, and other buildings. ConceptDraw DIAGRAM is a perfect network diagramming software with samples and examples of WAN and LAN Diagrams, templates and collection of network components libraries. Computer Network Diagrams Solution for ConceptDraw DIAGRAM Mac and Windows is ideal for IT professionals, network engineers and network designers who need to visualize network architecture, to document LANs physical structure and arrangement, to draw Local Area Network (LAN) diagrams and schematics, WAN diagrams, physical office network diagrams and topologies, wiring drawings, etc. You can design all them easy using the predesigned vector objects of computers and computer network devices, hardware devices, peripheral devices, external digital devices, internet and logical symbols, and many other stencils from the Computer Network Diagrams libraries. ConceptDraw DIAGRAM offers a powerful and easy-to-use solution for those who looking for a Visio alternative for Mac. It is a world-class diagramming platform with dynamic presentation power.
Basic Diagramming
Perfect charts and graphics diagramming software with rich examples and template. ConceptDraw is ideal to draw Charts and Graphics.
Column Chart Examples
Column chart examples from ConceptDraw collection can help you find the best visual depiction for you data. You can easily modify column chart examples according to data you want to visualize.Rack Diagrams
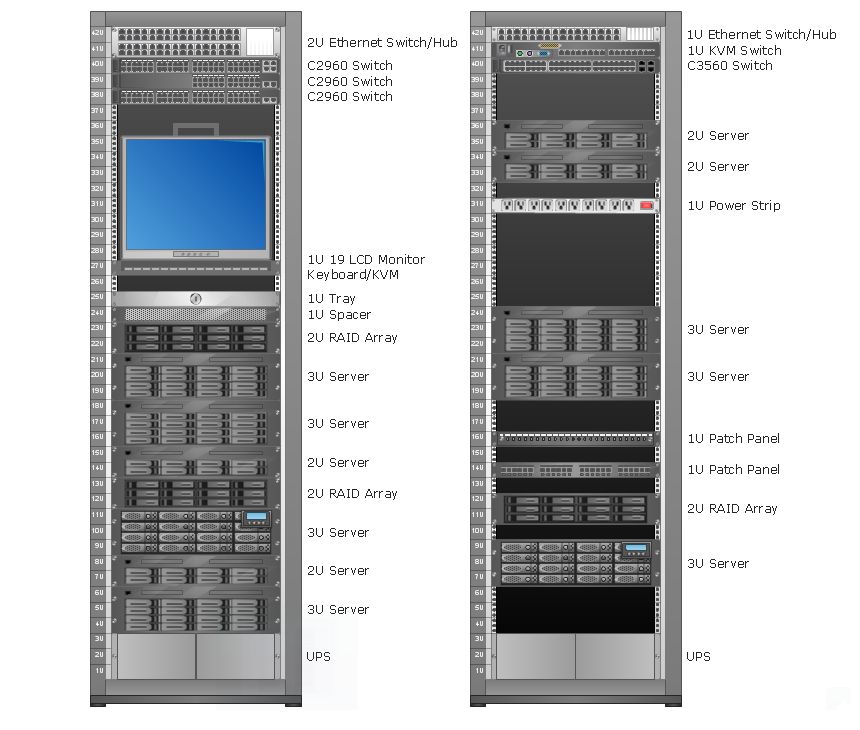
Rack Diagrams visualize the rack mounting of computer and network equipment as the drawing of frontal view of the rack with equipment installed. They are used for choosing the equipment or racks to buy, and help to organize equipment on the racks virtually, without the real installation.
- 3d Flow Chart
- 3D Network Diagram Software | Telecommunication Network ...
- Store Layout Software | Windows Azure | Flow chart Example ...
- Kitchen Design Software 3d Free Download
- Mobile Satellite Flowchart
- How To Make A 3d Flow Chart On Resoures
- Building Networks | Flow chart Example. Warehouse Flowchart | 3D ...
- Network Icons | Cubetto Flowchart | 3D Network Diagram Software ...
- Design elements - 3D directional maps | Process Flowchart | Basic ...
- Best 3d Graphic Design Software
- 3D Network Diagram Software
- 3d Flow Chart Maker Software Free
- Flow chart Example. Warehouse Flowchart | 3d Supermarkets With ...
- Software Mapping 3d Work Flow Chart
- 3d Trade Show Booth Design Software Free
- Design elements - 3D directional maps | Process Flowchart ...
- Design elements - 3D directional maps | Basic Flowchart Symbols ...
- 3D Network Diagram Software
- 3D pictorial road map | Flow chart Example. Warehouse Flowchart ...


