This site uses cookies. By continuing to browse the ConceptDraw site you are agreeing to our Use of Site Cookies.

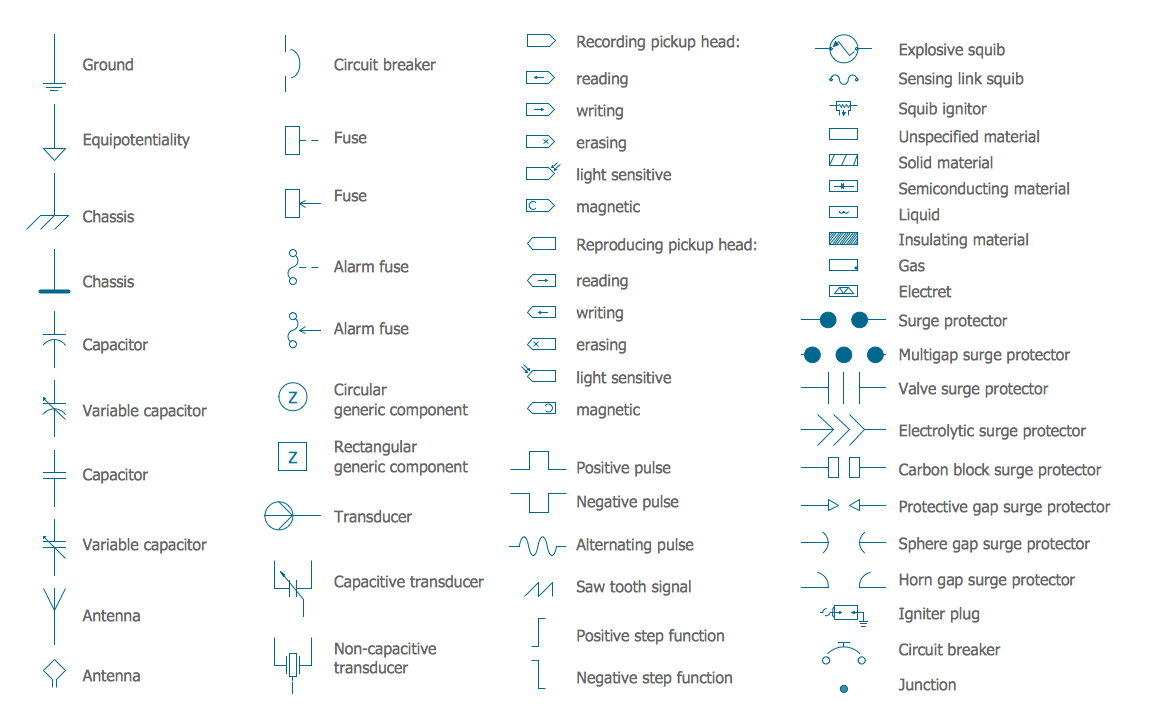
Electrical Symbols, Electrical Diagram Symbols

How to create Electrical Diagram? It’s very easy! All you need is a powerful software. It wasn’t so easy to create Electrical Symbols and Electrical Diagram as it is now with electrical diagram symbols offered by the libraries of Electrical Engineering Solution from the Industrial Engineering Area at the ConceptDraw Solution Park.
This solution provides 26 libraries which contain 926 electrical symbols from electrical engineering: Analog and Digital Logic, Composite Assemblies, Delay Elements, Electrical Circuits, Electron Tubes, IGFET, Inductors, Integrated Circuit, Lamps, Acoustics, Readouts, Logic Gate Diagram, MOSFET, Maintenance, Power Sources, Qualifying, Resistors, Rotating Equipment, Semiconductor Diodes, Semiconductors, Stations, Switches and Relays, Terminals and Connectors, Thermo, Transformers and Windings, Transistors, Transmission Paths,VHF UHF SHF.
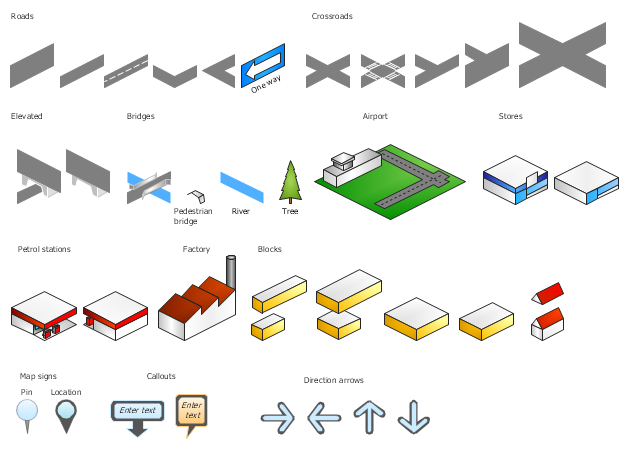
The vector stencils library "3D directional maps" contains 40 symbols for creating pictorial maps, street maps, locator maps, transit maps, tourist maps with points of interest (POI), road maps and route maps using the ConceptDraw PRO diagramming and vector drawing software.
"Pictorial maps are a category of maps that are also loosely called illustrated maps, panoramic maps, perspective maps, bird’s-eye view maps and Geopictorial maps amongst others. In contrast to the regular road map, Atlas or topographic cartography, pictorial maps depict a given territory with a more artistic rather than technical style. The cartography can be a sophisticated 3-D perspective landscape or a simple map graphic enlivened with illustrations of buildings, people and animals. They can feature all sorts of varied topics like historical events, legendary figures or local agricultural products and cover anything from an entire continent to a college campus. ...
Pictorial maps usually show an area as if viewed from above at an oblique angle. They are not generally drawn to scale in order to show street patterns, individual buildings, and major landscape features in perspective. While regular maps focus on the accurate rendition of distances, pictorial maps enhance landmarks and often incorporate a complex interplay of different scales into one image in order to give the viewer a more familiar sense of recognition." [Pictorial maps. Wikipedia]
The design elements library "3D directional maps" is included in the Directional Maps solution from the Maps area of ConceptDraw Solution Park.
3D pictorial map symbols
3D pictorial map symbols, tree, store, roof, building, road, river, pin, location, petrol station, pedestrian bridge, one way road, factory, elevated, crosswalks, crossroads, corner, bridge, airport,

Electrical Symbols — Electrical Circuits

A circuit diagram or wiring diagram uses symbols to represent parts of a circuit.
Electrical and electronic circuits can be complicated. Making a drawing of the connections to all the component parts in the circuit's load makes it easier to understand how circuit components are connected. Drawings for electronic circuits are called "circuit diagrams". Drawings for electrical circuits are called "wiring diagrams".

26 libraries of the Electrical Engineering Solution of ConceptDraw DIAGRAM make your electrical diagramming simple, efficient, and effective. You can simply and quickly drop the ready-to-use objects from libraries into your document to create the electrical diagram.

Pictorial Chart

You want design Pictorial Chart or Infographic? And you need powerful infographic software? Then ConceptDraw DIAGRAM diagramming and vector drawing software extended with Pictorial Infographics Solution from the “Infographics” Area is exactly what you need.

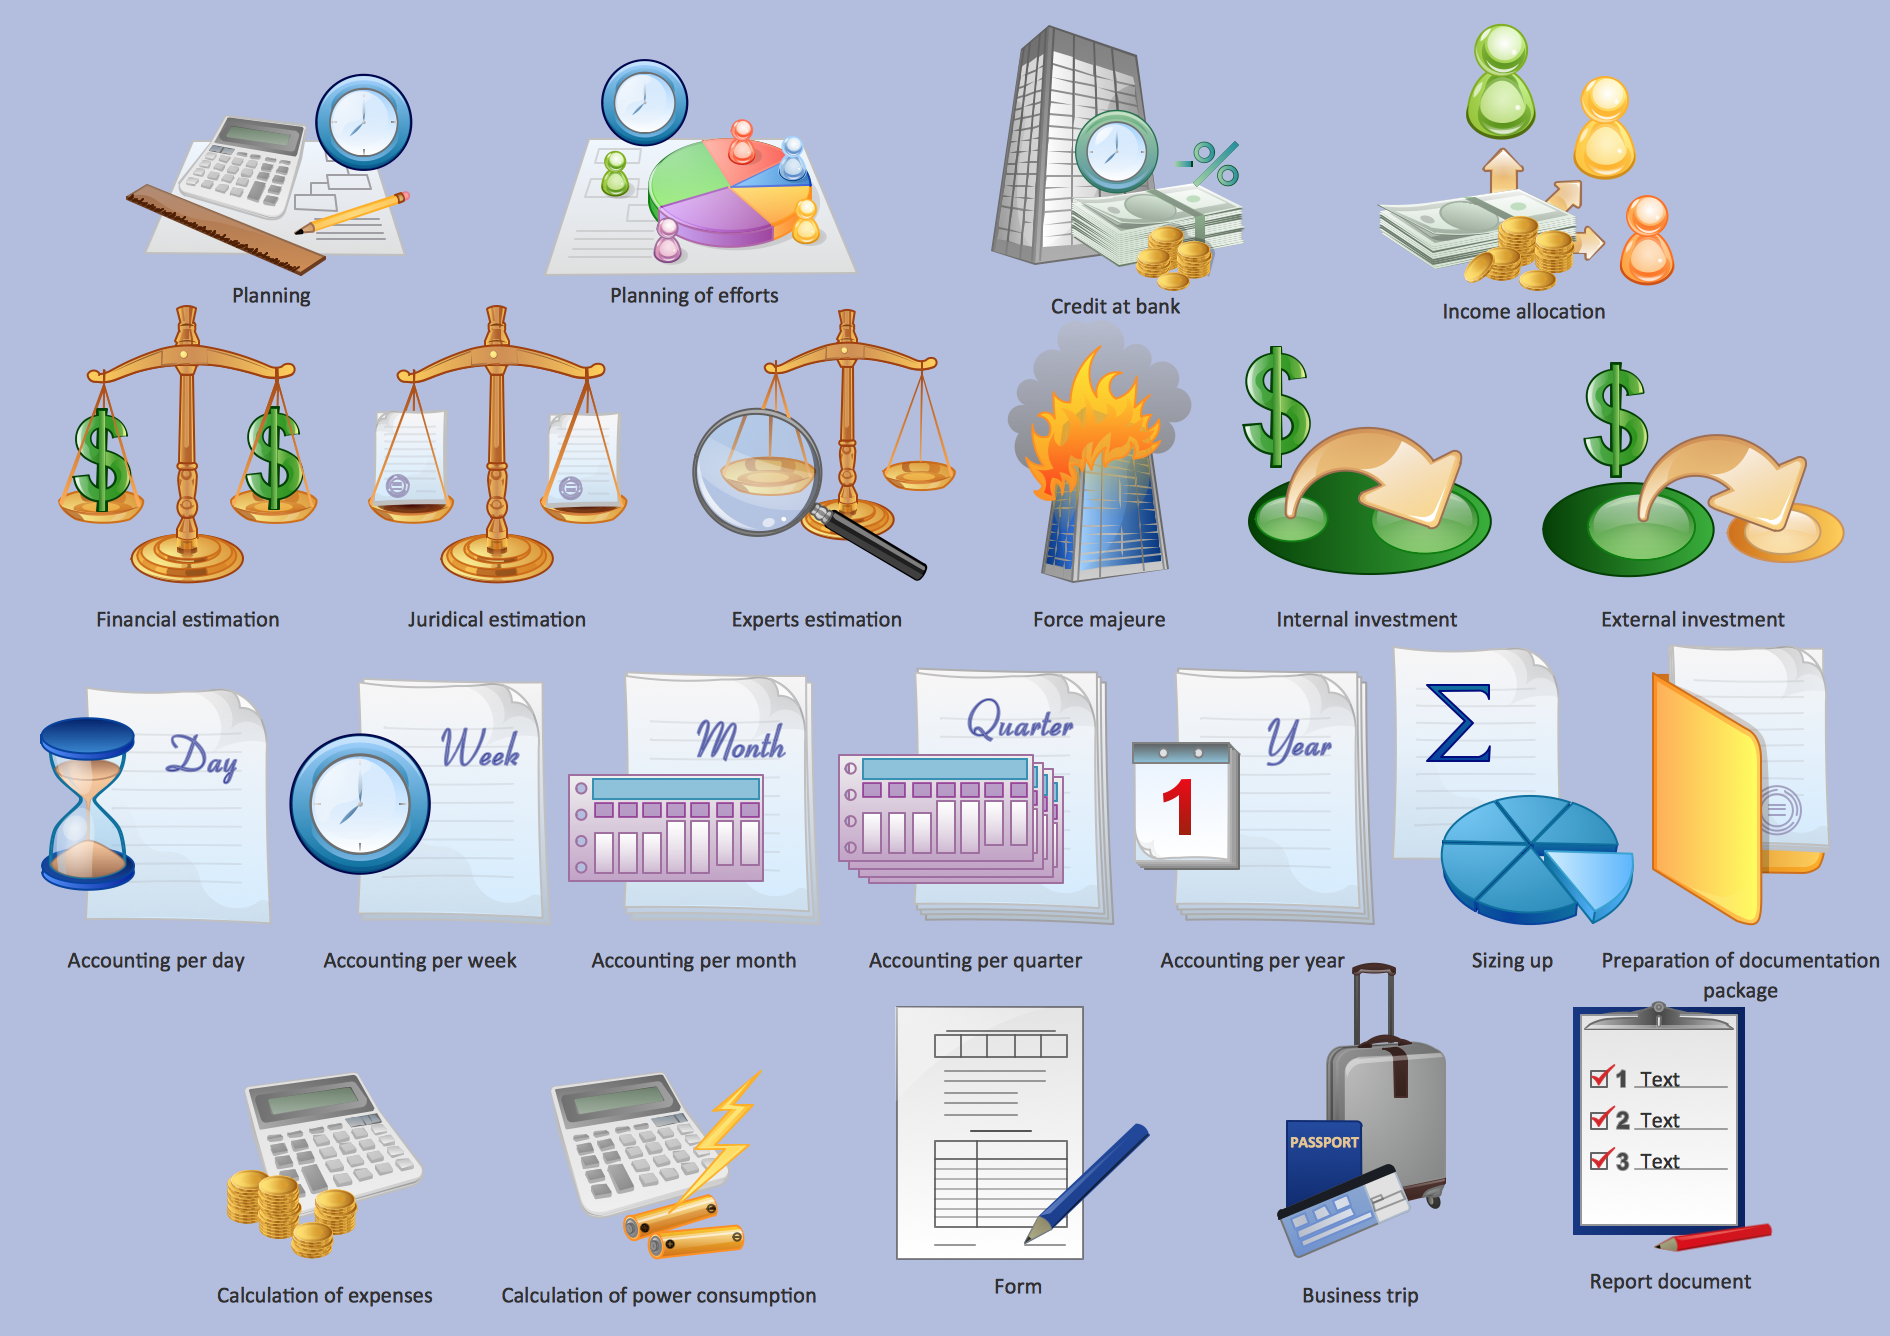
Management - Design Elements

When you need to draw a professional management drawing, these management design elements, samples, templates and libraries with vector clip art for drawing the Marketing Illustrations. Conceptdraw symbols and signs you can use in your design for Strategic Management, Graphic Design, Planning implementation and more.

You can create and view impact analysis drawings from specific design elements to examine the tasks.

Basic Flowchart Symbols and Meaning

Flowchart Symbols and Meaning - Provides a visual representation of basic flowchart symbols and their proposed use in professional workflow diagram, standard process flow diagram and communicating the structure of a well-developed web site, as well as their correlation in developing on-line instructional projects. See flowchart's symbols by specifics of process flow diagram symbols and workflow diagram symbols.
How to Build a Flowchart

Workflow Flowchart Symbols

The Workflow diagrams are the specialized type of flowcharts which allow to visualize any sorts of step-by-step processes. They are usually created as flowcharts, with objects that represent in a simple visual manner the steps in the process connected by arrows that indicate the next step. The ability easily create Workflow diagrams visually describing the tasks, documents associated with the tasks, people which are responsible for execution at each stage of workflow is made possible with Workflow Diagrams solution. This solution extends ConceptDraw DIAGRAM with a Workflow Diagram library that contains large collection of predesigned workflow flowchart symbols.

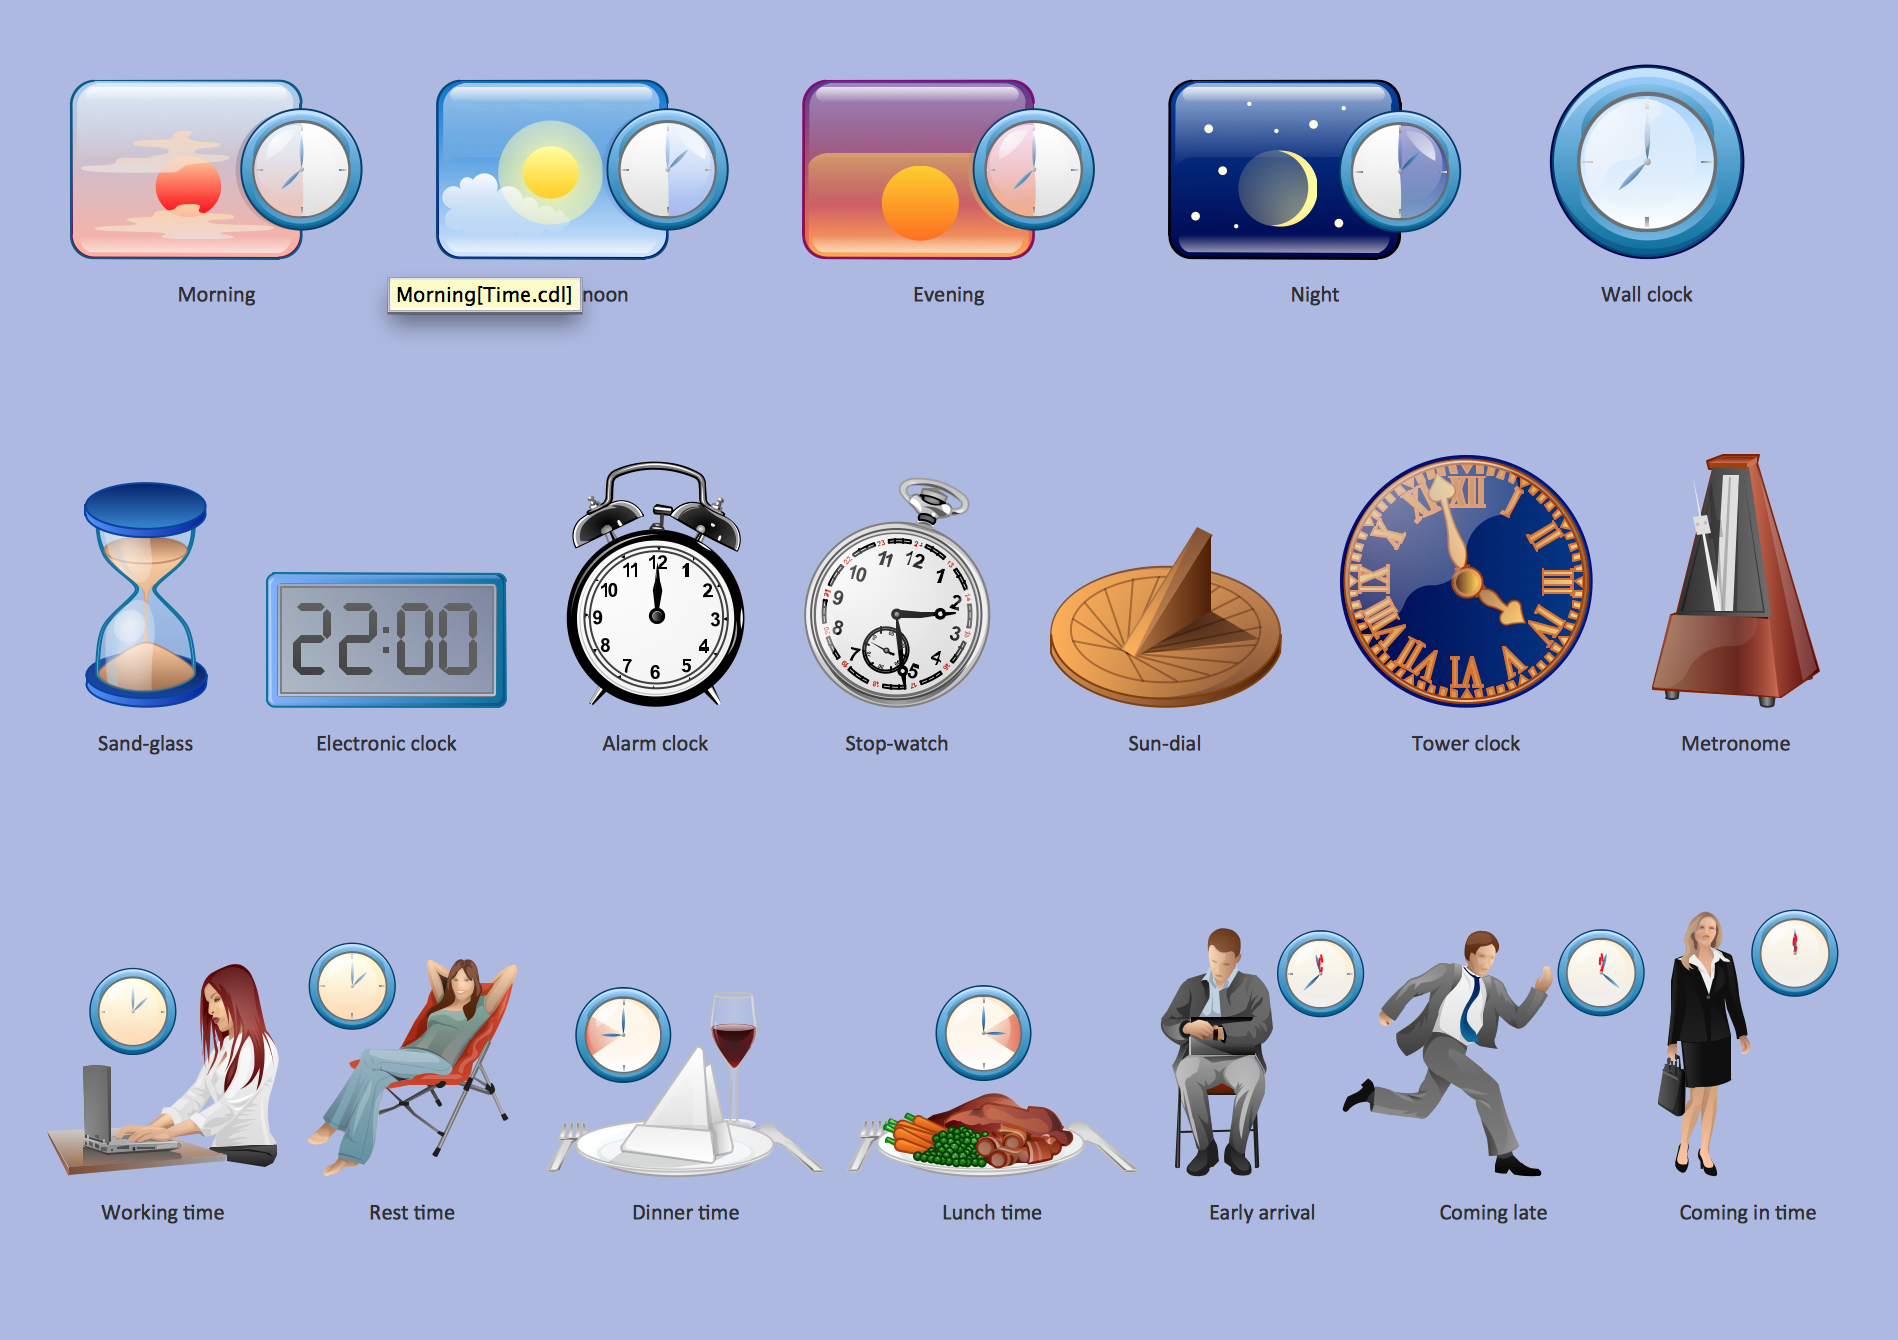
Time - Design Elements

Many of us want to be able to create designs efficiently yet quickly. ConceptDraw DIAGRAM will help you to make awesome drawings without having to design all those Time Elements. These elements include graphs, symbols, cliparts, visual data representation and a whole lot of other stuff.

Design Pictorial Infographics. Design Infographics

In the course of recent decades data visualization went through significant development and has become an indispensable tool of journalism, business intelligence and science. The way visual information may be conveyed is not limited simply to static or dynamic representation, it can also be interactive. Infographics can be conditionally divided into several general levels. Primarily, this is level of visualization of information, its interpretation and association on any ground. Second level can be defined as a visualization of knowledge, depiction of thoughts and ideas in the form of images or diagrams. Finally, the level of data visualization, which processes data arrays in charts, enabling the information to be more clearly perceived. You can also identify the main approaches to the creation of infographics: exploratory and narrative. Exploratory method insists on minimalist design in favor of data precision without unnecessary details and is common for scientific researches and ana

Flowchart design. Flowchart symbols, shapes, stencils and icons

A flowchart is a type of diagram that represents an algorithm, workflow or process, showing the steps as boxes of various kinds - flowchart symbols, and their order by connecting them with arrows.
Mavericks have always desired to stand apart and gorgeous design is the recipe for that. Any business graphic document will be more understandable if will use an expository color scheme for their parts. Flowchart design makes versatile presenting and explaining of the process and gives a fresh view that distinguishes it from black and white flowcharts on a paper. Workflow diagram or process flow diagrams become more understandable to ordinary people when it use minimum symbols and special signs.
The best design can be accomplished by starting from any of the suitable Conceptdraw examples. Pick one of them and begin to input proper text into each Flowchart symbols and shapes. Apply less colors in the document and don't turn into rainbow your diagram, three or four will be enough, also note that business process flowchart may not contain bright color hues. The next clue is to use identical colors for same flowchart shape types.
Business Process Modeling with ConceptDraw
Business Process Modeling with ConceptDraw "Business Process Diagrams" Solution