The UML diagrams in this Solution are divided into three broad categories:
Structure Diagrams
Behavior Diagrams
Interaction Diagrams
The seven Structure Diagrams are the core components that must be present in any system being modeled. These include:
Class,
Component,
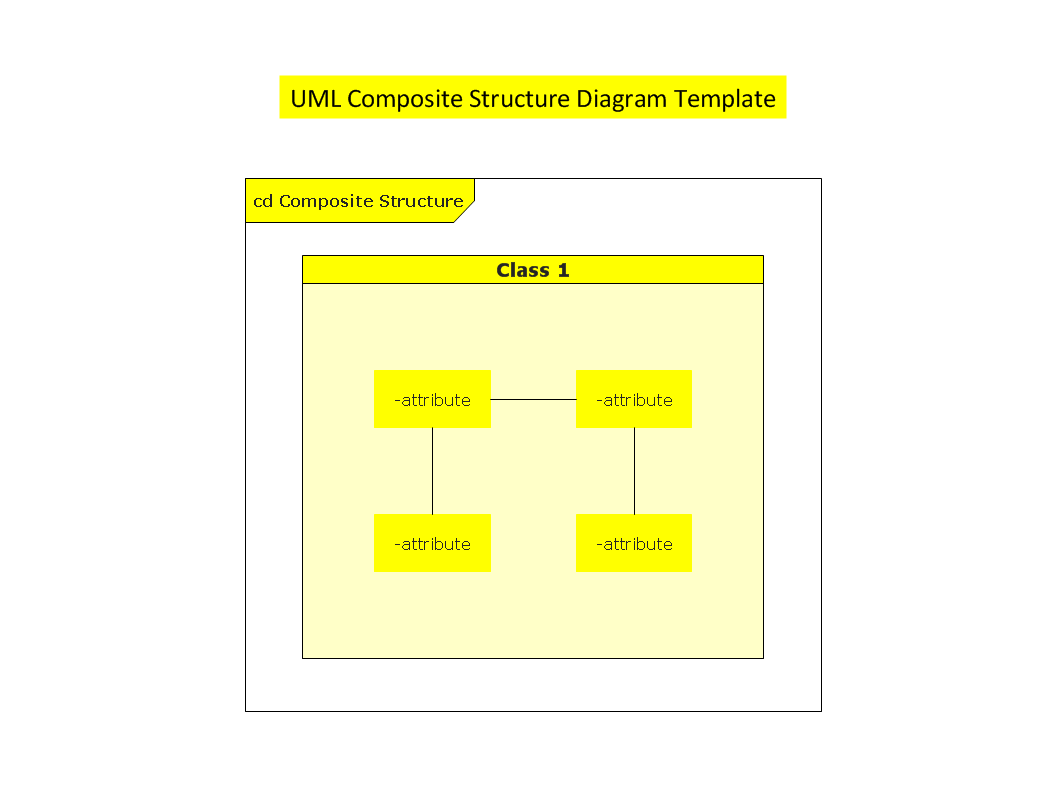
Composite Structure,
Deployment,
Object,
Package,
Profile diagrams.
To assign functionality, we have three Behavior Diagrams:
UML Activity,
UML State Machine,
Use Case diagrams.
The Interaction subgroup controls the flow of control and data, including diagrams for
Communication,
Interaction Overview,
Sequence,
and Timing.
For UML experienced users, the diagrams and objects will be familiar; while the Rapid Draw interface offers an intuitive way to connect and shape your diagrams. The solution is designed to make your UML diagramming simple, efficient, and effective. In the coming months, there will be more solutions making use of the Rapid Draw functionality.
Video 1. How to create your UML Diagram
ConceptDraw have released an exciting UML solution, using our intuitive RapidDraw technology. This video will take you through all the available diagrams, with a brief description of what each is capable of. This new solution can be found and downloaded through your ConceptDraw STORE.
Pic.1. UML Diagram solution (Mac OS and Windows®)
The 13 diagrams contained in the Rapid UML Solution offer an essential framework for systems analysts and software architects to create the diagrams they need to model processes from the conceptual level on through to project completion. Thanks to the tools in this Solution, UML diagramming has never been faster or easier.
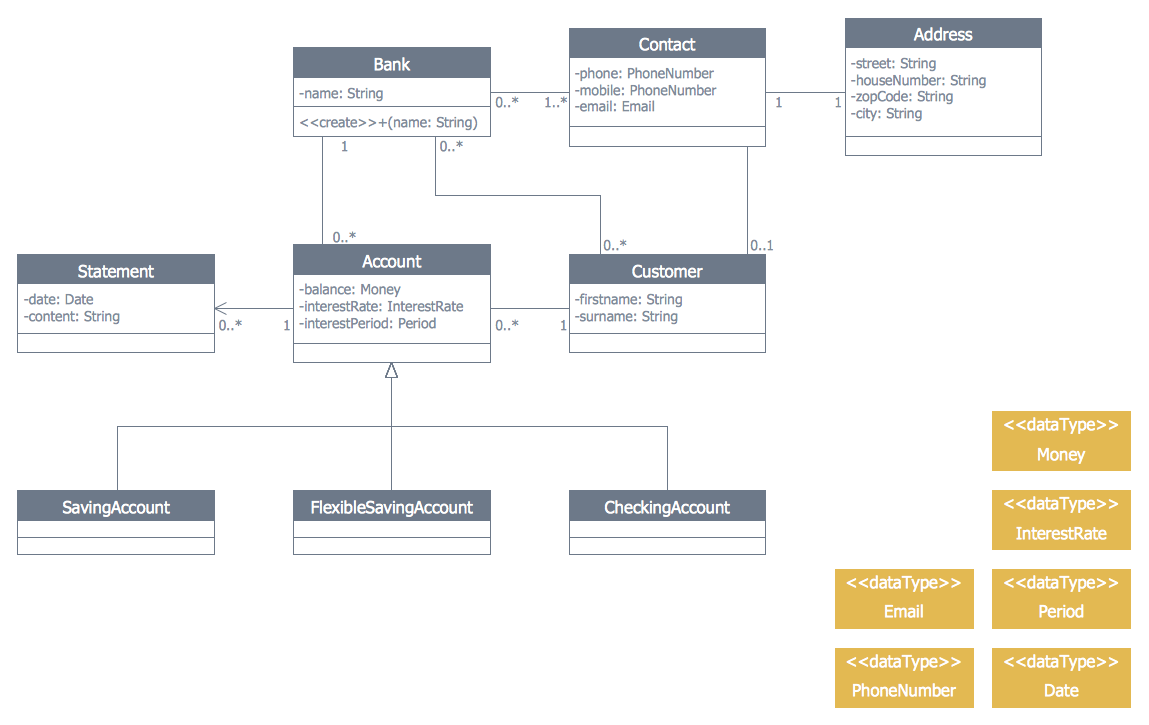
State Diagram UML of Online Store. This sample was created in ConceptDraw DIAGRAM diagramming and vector drawing software using the UML Class Diagram library of the Rapid UML Solution from the Software Development area of ConceptDraw Solution Park.
This sample shows the work of the medical shop and is used at the creation of the medical shop or pharmacy project, for understanding the process of shopping in the medical shop, for keeping purchases, for medical supplies.
Process Flow Chart is a visual illustration of overall flow of activities in producing a product or service. How do you make a Process Flow Chart usually? Drawing process flow charts, diagrams and maps is quite complex and lengthy process, especially if you draw free-hand. But now thanks to the ConceptDraw DIAGRAM diagramming and vector drawing software extended with Flowcharts solution from the Diagrams area of ConceptDraw Solution Park this process became simple and fast. A confirmation of this can serve many Process Flow Chart examples included in Flowcharts solution.
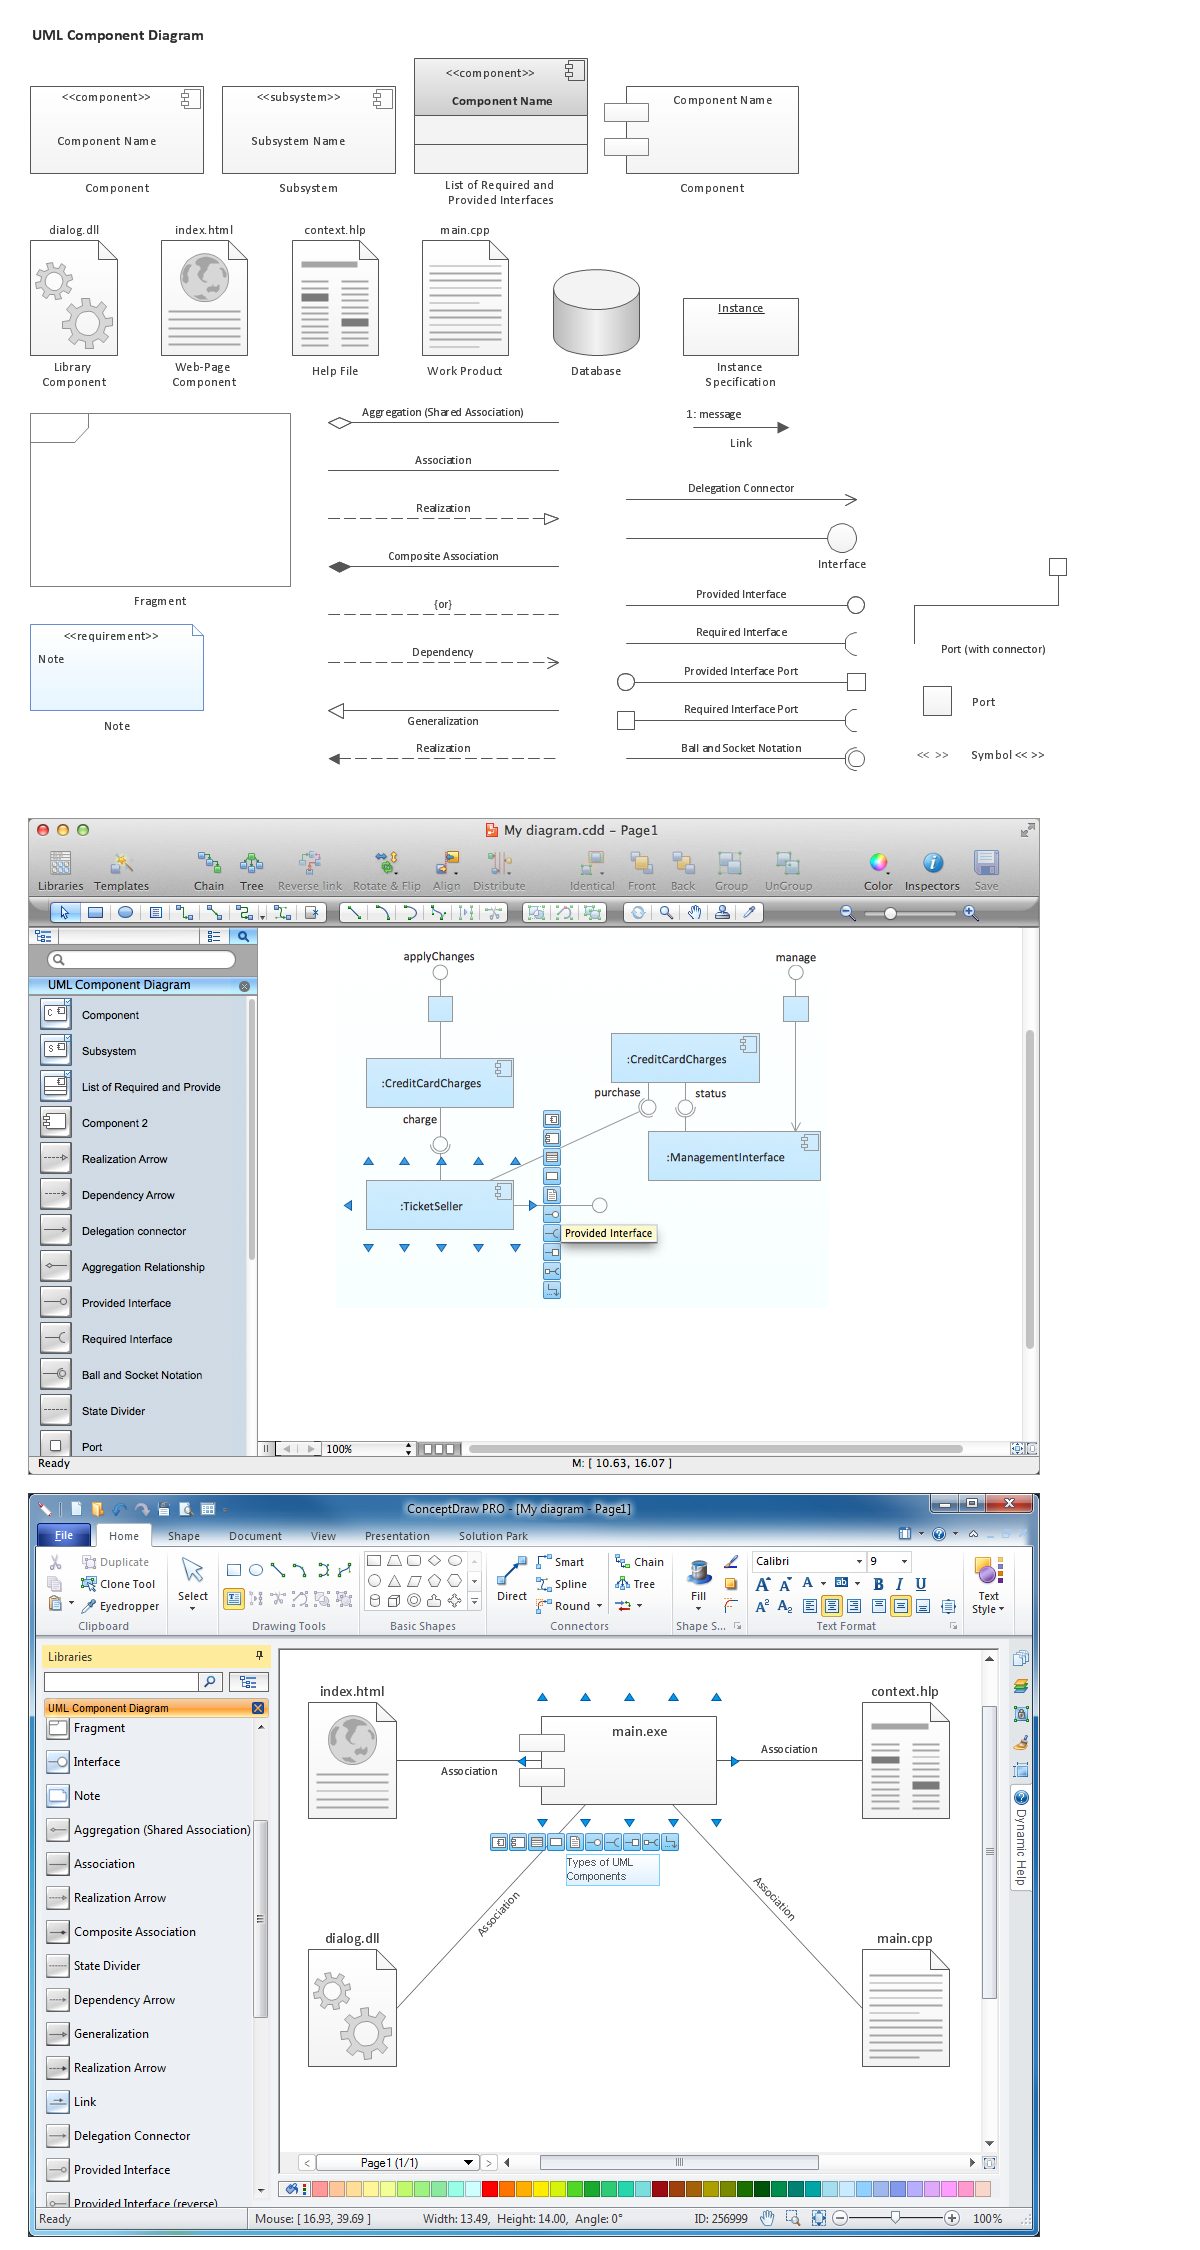
UML Component Diagram illustrate how components are wired together to larger components and software systems that shows the structure of arbitrarily complex systems.
ConceptDraw Rapid UML solution delivers libraries contain pre-designed objects fit UML notation, and ready to draw professional UML Component Diagram.
Picture: Diagramming Software for Design UML Component Diagrams
You can use many tools to create a representation of a system behavior or a scheme of objects relationships. Some of them are quite abstract and useless, and some, like UML tools help clarifying both the structure and the behavior of a system. There are various types of uml diagrams and tons of examples explaining the difference between them.
UML 2.2 specification has many kinds of diagrams. They are divided into two groups( structure and behavior diagrams). This class diagram shows the hierarchical structure of UML 2.2 specification. Class diagram - the most suitable tool for this task because it is designed to describe basic structure of a system. This diagram can be use as a visual aid for learning UML.
There are many ways to describe a database structure. One of the most usual is to draw an entity relationship diagram (ERD) using a Crow’s Foot notation to represent database elements. If you don’t want to draw it on paper, you should use an appropriate software.
An entity-relationship (ER) diagram is used to show the structure of a business database. ERD represents data as objects (entities) that are connected with standard relationships symbols which Illustrate an association between entities. ERD, there is a wide range of ERD notations used by data bases architects for reflecting the relationships between the data entities. According to the crow’s foot notation relationships are drawn as single labeled lines designating a certain kinds of relationship. Crow foot notation is a most frequently used ERD standard, because of improved readability of diagrams, with a more accurate use of space on the page.
Picture: Entity Relationship Diagram - ERD - Software for Design Crows Foot ER Diagrams
ConceptDraw DIAGRAM extended with ATM UML Diagrams Solution from the Software Development Area of ConceptDraw Solution Park is a powerful software for representing the ATM processes, for designing and building banking system and ATMs.
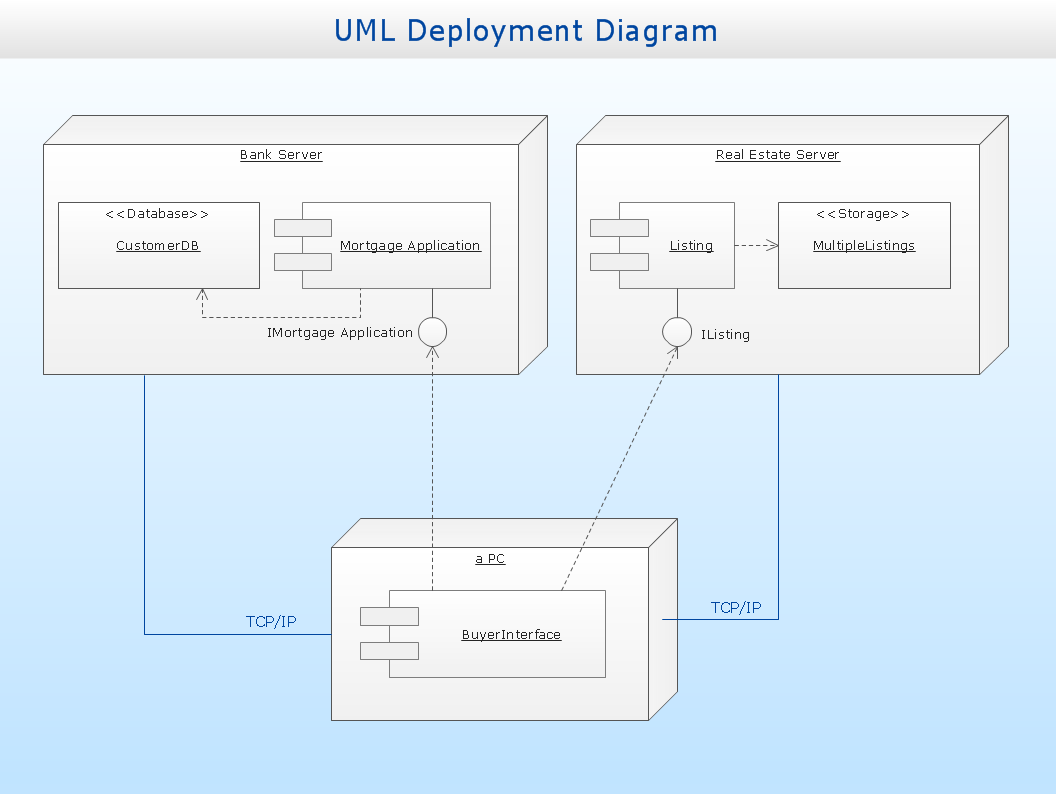
UML Deployment Diagram depicts the physical deployment of artifacts on nodes (nodes are the existing hardware components, artifacts are the software components running on each node); and how the different pieces are connected.
Use ConceptDraw DIAGRAM with UML deployment diagram templates, samples and stencil library from Rapid UML solution to model the physical deployment of artifacts on nodes of your software system.
Data base diagrams describes inter-related data and tables. It describes roles and relationships, internal and external dependencies, data exchange conventions and structures of knowledge domain.
ConceptDraw Software provides number of data-base chart libraries including major 49 vector symbols. Use these DFD flowchart symbol libraries to design data-base structure and models, use it to design data base process-oriented models, or simple data-oriented models. The are special drawing tools for making data flowcharts, data process diagrams, structured analysis diagrams, and information flow diagrams.
When you need to visually represent the structure of relational database, Entity relationship diagram (ERD) is a type of diagram for that case.
Most entity-relationship diagrams can be built with objects from Flowchart solution or ERD Solution which contains inbuilt templates. Follow these steps to create your own custom ERD diagram.
Don't be frightened if it looks complex, ConceptDraw DIAGRAM makes it easy to create an ERD, and hundreds of other diagrams, in minutes.


_Win_Mac.png)