Made with
ConceptDraw
DIAGRAM 18

Mycosis

Mycosis is an infection caused by fungi (yeast or mold). It can affect skin, nails, hair, mucous membranes, lungs, throat, urinary tract, and other organs and systems of organs in humans and animals. Fungi spread out spores into the air or environment and millions of fungi species live everywhere: on surfaces, items, plants, in soil, on the skin of humans and animals, and can cause health problems. Anyone can get a fungal infection, however, people with a weakened immune system, after operations, transplantation of organs, having changes in hormone levels, or taking immunosuppressant medications have a higher risk for fungal infections and complications of them.

Symptoms of mycosis depend on the kind of infection. The most common fungal skin infections are jock itch, athlete's foot, yeast infections, and ringworm. A fungal infection may cause irritation, redness, itching, swelling, scaly skin, blisters, rashes, bumps, peeling or cracking skin, stinging or burning sensations in the infected area, and other symptoms. Plural mycoses are life-threatening and occur when fungal infection invades the tissues and causes superficial, subcutaneous, and systemic diseases.

Common ways to get fungal infections include injuries, breaking skin, breathing fungi spores with the air, ingestion of spores in the organism with dirty or spoiled food, direct contact with an infected person or animal, visiting public spaces like public showers or locker rooms without sandals or flip-flops, sharing private items (towels, shoes, sports equipment, etc.). However, many fungi can live in the human body, but grow and harm only under certain circumstances.

There are superficial, subcutaneous, and deep or invasive fungal infections. As a rule, superficial fungal infections are not serious and are easily treated, however, treatment takes some time. At the same time, deep fungal infections are life-threatening, especially in people with a weakened immune system.

  • Superficial fungal infections affect the skin, nails, and mucous membranes. They include ringworm, onychomycosis, candidiasis, tinea, and pityriasis versicolor. Ringworm, tinea or dermatophytosis is caused by around 40 species of fungi that affect the scalp, feet, and other areas of the skin. Tinea pedis fungi include Trichophyton rubrum, Epidermophyton floccosum, Trichophyton interdigitale. Onychomycosis is a fungal nail infection caused by dermatophytes, yeasts, or molds (Trichophyton rubrum, Trichophyton interdigitale, Candida albicans, Scopulariopsis brevicaulis) entering the nail through small cracks in it, cuts on the skin around the nail, or small separations between the nail and nail bed. The yeast Candida also causes thrush infection.
  • Subcutaneous infections are underneath your skin and are more common in tropical and subtropical areas. They are the result of entering fungi into a cut, wound, or scratch, and cause rashes, redness, ulcers, and other symptoms on your skin. These include sporotrichosis, chromoblastomycosis, and eumycetoma.
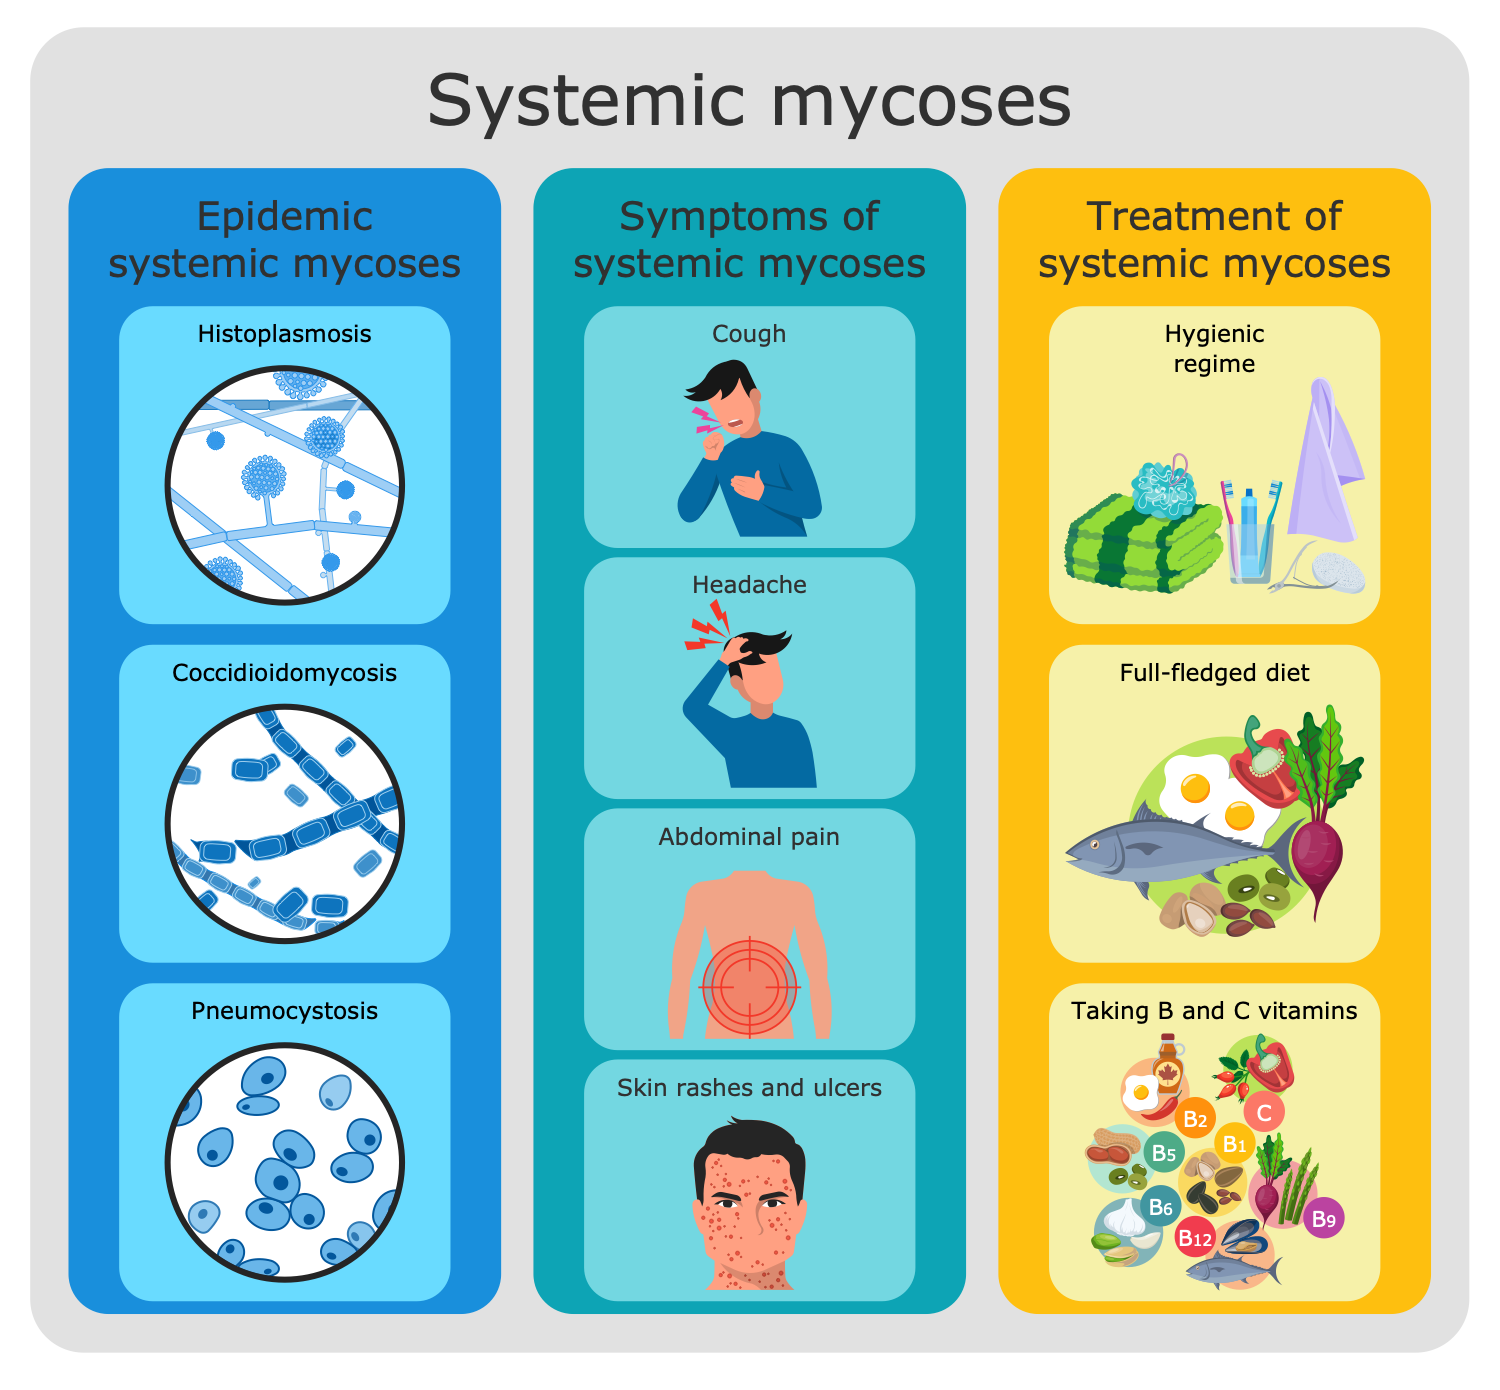
  • Deep fungal infections are those that affect the lungs, blood, brain, heart or other organs of the human body. These are histoplasmosis, blastomycosis, coccidioidomycosis, aspergillosis, candidiasis, cryptococcosis, pneumocystis pneumonia, and mucormycosis.
Mycosis - Different Forms

Example 1. Mycosis - Different Forms

Antifungal medications are used to treat mycosis. They are targeted the fungal cell membranes and the fungal cell walls without harming the cells of the human body. There are provided different forms of antifungals: lotions, creams, liquids, sprays, mouthwashes, drops, powder, shampoo, oral pills, and IV medication. The form of medication is chosen by your doctor depending on the fungi type, contaminated area, and degree of severity. Some treatments are available without a prescription, however, it is highly recommended to check with your doctor before treatment. Depending on the severity of the infection, treatment can take a short or long time, and sometimes in several stages to fully cure the infection.

Prevention of infection with mycosis includes practicing personal hygiene, keeping skin and nails clean and dry, daily change of underwear, using shoes in public bathrooms, showers, or locker rooms, using protective gloves when working with soil, also wearing protective masks and clothing when cleanup mold in the premises. In addition, don’t share your personal items, towels, or sports equipment, wear shoes that allow your feet to breathe, and take antibiotics only if they are prescribed by the doctor.

Medical Mycology Libraries Design Elements

Example 2. Medical Mycology Libraries Design Elements

Striving to find the best software for medical mycology illustration, turn your attention to ConceptDraw DIAGRAM software and Medical Mycology solution. Due to the powerful drawing tools and included multifarious collection of 365 predesigned vector clipart, pictograms, and illustrative samples, it is the best assistant for creating infographics, diagrams, illustrations, and drawings.

Use Medical Mycology solution to outline the groups of mycosis pathogens, show the most dangerous fungi types and indicate who is in the at-risk group. List the ways to prevent mycosis and fungal diseases and offer an overview of the most common symptoms of mycosis to detect disease at the earliest stage. The solution is also useful to illustrate the methods of mold control and cleanup premises, kinds of antifungal medication, and ways to treat systemic mycoses.

Dermatophytosis Types

Example 3. Dermatophytosis Types

The mycology infographics you see on this page were created in ConceptDraw DIAGRAM software using the Medical Mycology Solution. They successfully demonstrate the solution's capabilities and the professional results you can achieve. An experienced user spent 10-15 minutes creating each of these samples.

Use the powerful tools of the Medical Mycology Solution for ConceptDraw DIAGRAM software to create your own infographics and diagrams of any complexity fast and easy, and then successfully use them in your work activity.

All source documents are vector graphic documents. They are available for reviewing, modifying, or converting to a variety of formats (PDF file, MS PowerPoint, MS Visio, and many more graphic formats) from the ConceptDraw STORE. The Medical Mycology Solution is available for all ConceptDraw DIAGRAM users.

TEN RELATED HOW TO's:
Agile methodology is an excellent alternative to waterfall and traditional sequential development. ConceptDraw DIAGRAM software extended with SCRUM Workflow solution is ideal for quick and easy designing various diagrams, charts, mind maps and schematics illustrating software development using Agile methodologies, and in particular Scrum methodology.Agile Methodology *
Picture: Agile Methodology
Related Solution:
Any information system receives data flows from external sources. In order to visualize them there is a list of data flow diagram symbols that describes how the system components cooperate. If you want to create a data flow diagram, ConceptDraw DIAGRAM Solution Park has DFD Library that contains both Yourdon and Gane-Sarson notations. This figure shows the content of vector libraries, delivered with ConceptDraw solution for data flow diagram (DFD). There are three libraries composed from about 50 vector objects used to make data flow diagrams. They include a complete set of objects utilized by Yourdon-Coad and Gane-Sarson notations - two primary notations that are apply for data flow diagramming. Also, one can discover additional "Data flow diagram (DFD)" library that provides a data flow diagram elements for designing level 1 and context-level data flow diagrams.Data Flow Diagram Symbols. DFD Library *
Picture: Data Flow Diagram Symbols. DFD Library
Related Solution:
There are many ways to define the flow of information within a system. Structured-systems analysis method often uses data flow diagrams to show data flow, data storages and data processing visualization. These diagrams are easy to develop and quite useful. Here is a dataflow diagram presenting an example of the manufacturing process flow. The oval process shapes represent a process that controls data within the current system. The process may produce data or make some action based on data. Data flows are represented by lines. They show the movement of information through the system. The direction of the data flow is depicted by the arrow. The external entities are shown by rectangles. They represent the external entities interacting with the system. The data store objects (unclosed rectangles) are used to show data bases participating in a process flow.Data Flow Diagram *
Picture: Data Flow Diagram
Related Solution:
There are numerous articles about the advantages of flowcharting, creating business graphics and developing different charts. Nevertheless, these articles are almost useless without the main component - the examples of flowcharts, org charts and without a fine example, it is difficult to get all the conveniences of creating diagrams. You can find tons of templates and vivid examples on Solution Park. This illustration shows a variety of business diagrams that can be created using ConceptDraw DIAGRAM. It comprises a different fields of business activities: management, marketing, networking, software and database development along with design of infographics and business illustrations. ConceptDraw DIAGRAM provides a huge set of sample drawings including business process modeling diagrams,, network diagrams, UML diagrams, orgcharts, DFD, flowcharts, ERD, geographical maps and more.Examples of Flowcharts, Org Charts and More
Picture: Examples of Flowcharts, Org Charts and More
Related Solution:
When we think about programming, we usually imagine sleepless nights spent on writing kilobytes of code. However, from another point of view, Software development with ConceptDraw DIAGRAM makes a programmer's life endlessly easier. This tool is unique to fulfill all your needs in short period of time. Over the recent years object-oriented methodology has become more and more widespread. Thanks to this methodology developers manage to deal with growing complexity of applications. More and more programs are written in such programming languages as C++, Java, Visual Basic and Object Pascal. However, the complexity of the designed systems imposes extended requirements as to design of graphic documentation. ConceptDraw possesses powerful tools for designing of technical documentation for object-oriented projects. The libraries included in the package allow to easily draw class hierarchies, object hierarchies and diagrams of data flows with the use of the most popular notations, including UML and Booch notations. And the library for projecting COM-interfaces will spare developers of ActiveX-servers a headache.Software development with ConceptDraw DIAGRAM  *
Picture: Software development with ConceptDraw DIAGRAM
IT world is extremely rational and logical. So what can be more precise than Software Diagrams to rate the results of work? Visual statistics is the best way to understand the data. This figure demonstrates the data flow diagram (DFD), which was created to describe the electronic system of custom purchase. This is the process of buying using electronic bar code scanning system. Such systems are used in large stores. The cashier scans the bar code, the system outputs the data on the price of the goods and carries out a purchase process. This DFD utilizes the Gane/Sarson notation. To create it The ConceptDraw DFD solution has been applied.Software Diagrams
Picture: Software Diagrams
Meeting ice hockey rules one should learn ice hockey rink terms, lines, zones etc. ConceptDraw DIAGRAM is an advanced drawing software that allows you produce ice hockey rink depiction of any complexity, from simple sketch drawing to detailed one as on example below.Ice Hockey Rink Dimensions *
Picture: Ice Hockey Rink Dimensions
Related Solution:
When we start to speak about databases, we must always mention database structure visualization. One of the most common ways to do it is to create an entity relationship diagram, and to put appropriate symbols on it. It is important either for database projecting and for its' future maintenance. Entity Relationship Diagram describes data elements and their relationships within a database. There are a set of special symbols that depict each element of an entity relationship diagram. Entities - represents some stable components such as supplier, employee, invoice, client, etc. Relation symbols show how the entities interact. Attributes define characteristics of the relationships. Attributes can be one-to-one or many-to-many. Physical symbols is used in the physical models. They represent items such as fields, tables, types and keys. ERD physical symbols are the building material for the database. Notation lines are used to illustrate the relationships. The most common method is Crow’s Feet notation. You can use ConceptDraw Entity-Relationship Diagram (ERD) solution to represent a database using the Entity-Relationship model.Entity Relationship Diagram Symbols
Picture: Entity Relationship Diagram Symbols
Related Solution:
The SWOT Analysis solution contains easy-to-use mind map templates that help identify Strengths, Weaknesses, Opportunities, and Threats, as well as outputs to ConceptDraw DIAGRAM for presenting analysis results.SWOT Analysis *
Picture: SWOT Analysis
Related Solution:
The recruitment process often requires design and use of various HR flowcharts, diagrams, attractive illustrations.Recruitment
Picture: Recruitment
Related Solution:
ConceptDraw
DIAGRAM 18