Immunology Activities
Immunology is a study of the immune system, an important branch of the biomedical sciences. The correct functioning of the immune system provides a proper work of a whole body and reliable defense from the different diseases. Some violations in the functioning of the immune system may conduct for disruptions, disorders, and serious diseases. Among them the allergy, asthma, immunological deficiency syndrome, cancer, and even those that are not originally immunologic diseases (cardiovascular, metabolic, etc.).
The immune system is an incredibly complex system. It protects us from different kinds of infections through various lines of defense and includes the innate and adaptive immune systems. A lot of varied immunological cells and neurotransmitters are contained in the immune system. They are synthesized in response to foreign agents, stress, autoimmune reactions, mechanical injuries.
The immunology field includes a wide range of immunology activities directed at the study of a human immune system, processes occurring in it, immunological diseases, ways to detect and defeat them. It includes extensive research work, activities on the development and implementation of new technologies, methods, instruments, and equipment.
The immunology development led to great results in medicine: discovery of new methods of diagnostics and treatment a wide array of diseases, introduction a vaccination, invention vaccines against a lot of viruses and pathogens. They contributed to the identification of blood groups, safe organ transplantation, use of monoclonal antibodies, treatment of autoimmune diseases, etc. The technical progress also played an important role in the development of modern research techniques, methods, and tools in the immunology field.
ConceptDraw DIAGRAM vector design software extended with the Immunology solution from the Health area of ConceptDraw Solution Park is the best way to complete the task of illustrating the key immunology issues. It helps to visualize the immunology activities, methods, technologies, instruments, equipment used in this area, results of researches, and much more.
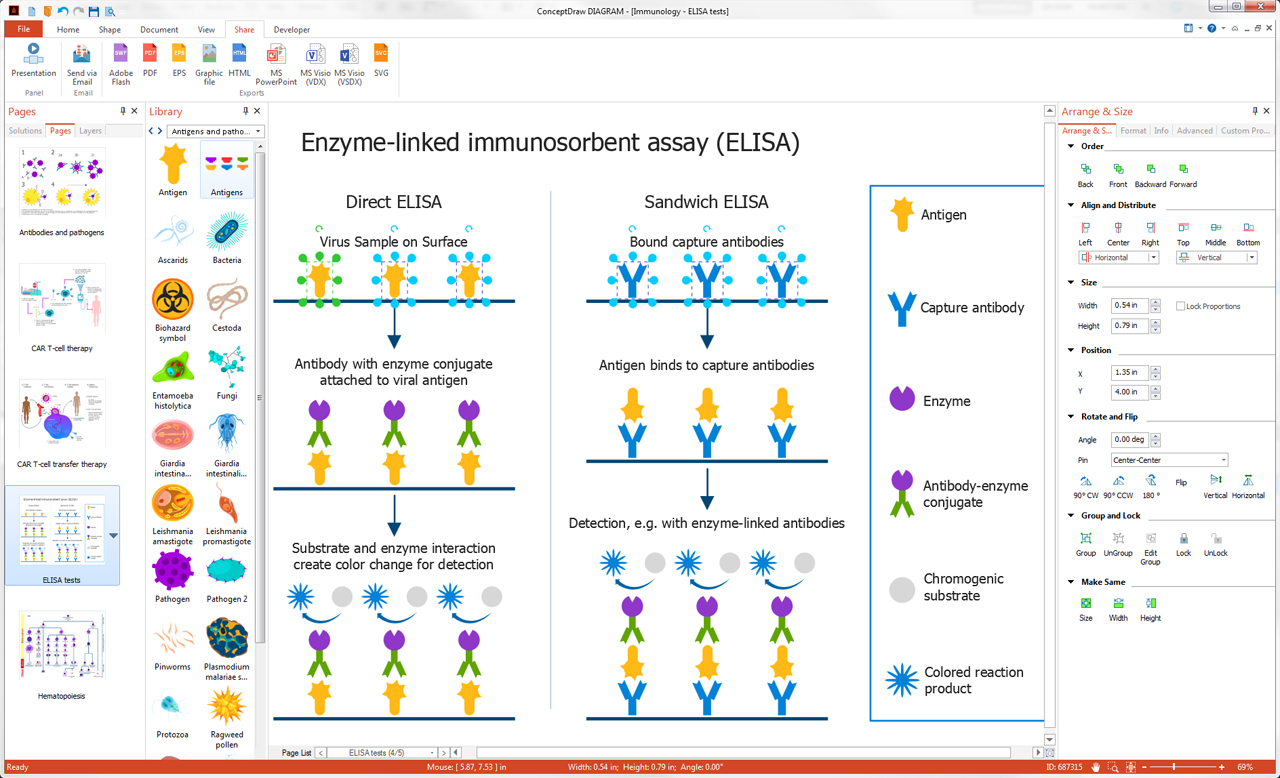
Example 1. Immunology Activities Illustration in ConceptDraw DIAGRAM
In order to describe the immunology activities with help of diagrams and illustrations in ConceptDraw DIAGRAM, use the pre-made vector design stencils, objects, icons, and clipart included to 14 libraries of the Immunology solution:
- Medical Immunology
- Immune Cells
- Immune Organs
- Immunoassay
- Immunoreceptors
- Immunotherapy
- Antibody
- Antigens and Pathogens
- Complement System
- Hematopoiesis
- Immunology Lab
- Animal Immunization
- Vaccine
- Vaccine Cold Chain
You can also start with any included immunology sample. All samples are available from the ConceptDraw STORE and can be used as-is or slightly redesigned according to your own requirements.

Example 2. Immunology Illustration - CAR T-Cell Transfer Therapy
The immunology illustrations you see on this page were created in ConceptDraw DIAGRAM software using the Immunology Solution. They successfully demonstrate solution's capabilities and professional results you can achieve in illustration of the immunology activities. An experienced user spent 15-20 minutes creating each of them.
Use the powerful tools of the Immunology Solution for ConceptDraw DIAGRAM software to create your own illustrations and diagrams of any complexity fast and easy, and then successfully use them in your work activity.
All source documents are vector graphic documents. They are available for reviewing, modifying, or converting to a variety of formats (PDF file, MS PowerPoint, MS Visio, and many other graphic formats) from the ConceptDraw STORE. The Immunology Solution is available for all ConceptDraw DIAGRAM users.
TEN RELATED HOW TO's:
Agile methodology is an excellent alternative to waterfall and traditional sequential development. ConceptDraw DIAGRAM software extended with SCRUM Workflow solution is ideal for quick and easy designing various diagrams, charts, mind maps and schematics illustrating software development using Agile methodologies, and in particular Scrum methodology.
Picture: Agile Methodology
Related Solution:
Any information system receives data flows from external sources. In order to visualize them there is a list of data flow diagram symbols that describes how the system components cooperate. If you want to create a data flow diagram, ConceptDraw DIAGRAM Solution Park has DFD Library that contains both Yourdon and Gane-Sarson notations.
This figure shows the content of vector libraries, delivered with ConceptDraw solution for data flow diagram (DFD). There are three libraries composed from about 50 vector objects used to make data flow diagrams.
They include a complete set of objects utilized by Yourdon-Coad and Gane-Sarson notations - two primary notations that are apply for data flow diagramming. Also, one can discover additional "Data flow diagram (DFD)" library that provides a data flow diagram elements for designing level 1 and context-level data flow diagrams.
Picture: Data Flow Diagram Symbols. DFD Library
Related Solution:
There are many ways to define the flow of information within a system. Structured-systems analysis method often uses data flow diagrams to show data flow, data storages and data processing visualization. These diagrams are easy to develop and quite useful.
Here is a dataflow diagram presenting an example of the manufacturing process flow. The oval process shapes represent a process that controls data within the current system. The process may produce data or make some action based on data. Data flows are represented by lines. They show the movement of information through the system. The direction of the data flow is depicted by the arrow. The external entities are shown by rectangles. They represent the external entities interacting with the system. The data store objects (unclosed rectangles) are used to show data bases participating in a process flow.
Picture: Data Flow Diagram
Related Solution:
There are numerous articles about the advantages of flowcharting, creating business graphics and developing different charts. Nevertheless, these articles are almost useless without the main component - the examples of flowcharts, org charts and without a fine example, it is difficult to get all the conveniences of creating diagrams. You can find tons of templates and vivid examples on Solution Park.
This illustration shows a variety of business diagrams that can be created using ConceptDraw DIAGRAM. It comprises a different fields of business activities: management, marketing, networking, software and database development along with design of infographics and business illustrations. ConceptDraw DIAGRAM provides a huge set of sample drawings including business process modeling diagrams,, network diagrams, UML diagrams, orgcharts, DFD, flowcharts, ERD, geographical maps and more.
Picture: Examples of Flowcharts, Org Charts and More
Related Solution:
When we think about programming, we usually imagine sleepless nights spent on writing kilobytes of code. However, from another point of view, Software development with ConceptDraw DIAGRAM makes a programmer's life endlessly easier. This tool is unique to fulfill all your needs in short period of time.
Over the recent years object-oriented methodology has become more and more widespread. Thanks to this methodology developers manage to deal with growing complexity of applications. More and more programs are written in such programming languages as C++, Java, Visual Basic and Object Pascal. However, the complexity of the designed systems imposes extended requirements as to design of graphic documentation. ConceptDraw possesses powerful tools for designing of technical documentation for object-oriented projects. The libraries included in the package allow to easily draw class hierarchies, object hierarchies and diagrams of data flows with the use of the most popular notations, including UML and Booch notations. And the library for projecting COM-interfaces will spare developers of ActiveX-servers a headache.
Picture: Software development with ConceptDraw DIAGRAM
IT world is extremely rational and logical. So what can be more precise than Software Diagrams to rate the results of work? Visual statistics is the best way to understand the data.
This figure demonstrates the data flow diagram (DFD), which was created to describe the electronic system of custom purchase. This is the process of buying using electronic bar code scanning system. Such systems are used in large stores. The cashier scans the bar code, the system outputs the data on the price of the goods and carries out a purchase process. This DFD utilizes the Gane/Sarson notation. To create it The ConceptDraw DFD solution has been applied.
Picture: Software Diagrams
Meeting ice hockey rules one should learn ice hockey rink terms, lines, zones etc. ConceptDraw DIAGRAM is an advanced drawing software that allows you produce ice hockey rink depiction of any complexity, from simple sketch drawing to detailed one as on example below.
Picture: Ice Hockey Rink Dimensions
Related Solution:
When we start to speak about databases, we must always mention database structure visualization. One of the most common ways to do it is to create an entity relationship diagram, and to put appropriate symbols on it. It is important either for database projecting and for its' future maintenance.
Entity Relationship Diagram describes data elements and their relationships within a database. There are a set of special symbols that depict each element of an entity relationship diagram. Entities - represents some stable components such as supplier, employee, invoice, client, etc. Relation symbols show how the entities interact. Attributes define characteristics of the relationships. Attributes can be one-to-one or many-to-many. Physical symbols is used in the physical models. They represent items such as fields, tables, types and keys. ERD physical symbols are the building material for the database. Notation lines are used to illustrate the relationships. The most common method is Crow’s Feet notation. You can use ConceptDraw Entity-Relationship Diagram (ERD) solution to represent a database using the Entity-Relationship model.
Picture: Entity Relationship Diagram Symbols
Related Solution:
The SWOT Analysis solution contains easy-to-use mind map templates that help identify Strengths, Weaknesses, Opportunities, and Threats, as well as outputs to ConceptDraw DIAGRAM for presenting analysis results.
Picture: SWOT Analysis
Related Solution:
The recruitment process often requires design and use of various HR flowcharts, diagrams, attractive illustrations.
Picture: Recruitment
Related Solution:
