Energy
Energy is everywhere around us and we constantly use it. It has reliably entered our home and everyday life, has become a familiar and everyday part, and we cannot already imagine that could be otherwise. Energy is a necessary condition for the existence of mankind, it allowed people to adapt to the environment. It is also a key factor we use to have a comfortable life. And the consumption of energy is constantly growing. It powers the machines, automobiles, enterprises, homes, technique, electronic devices, and is a foundation of industry and manufacturing.
The modern energy industry is a large and growing industry involved in the manufacturing, refining, extraction, and sale of energy. As a result of demand and high consumption of energy, it is an incredibly important industry in the world. No industry has a bigger impact. The development of the energy industry, production and consumption of energy resources have a great impact on the global economy and are one of the main factors for its development.
Primarily, the energy industry is focused on coal, crude oil, natural gas, and electricity. The last two stay the most common sources of energy for years. However, the energy industry includes more divisions: oil industry, gas industry, electrical power industry, coal industry, renewable energy industry.
There are many companies involved in the extraction, refining, transportation, generation, sale, and supplying of different kinds of energy. The world energy consumption is counted annually and includes all energy harnessed from each energy source and used by humanity. The accounting and analysis of these data allow understanding of world trends and patterns, detecting the key energy issues and solving them.
The general trends indicate the considerable growth of oil and natural gas consumption at the simultaneous declining the coal consumption and growth of the use of hydropower and renewable energy in the last decades. The average energy use per person increases in the world for many reasons. Among them are the growth of the industry, the increase of automobiles, residential and commercial premises. The list of reasons also includes the raising of production and usage of electrical appliances and electronic devices. The expansion of data traffic and storage leads to the growth of a quantity of data centers. This also increases significantly the energy consumption.
Example 1. Energy
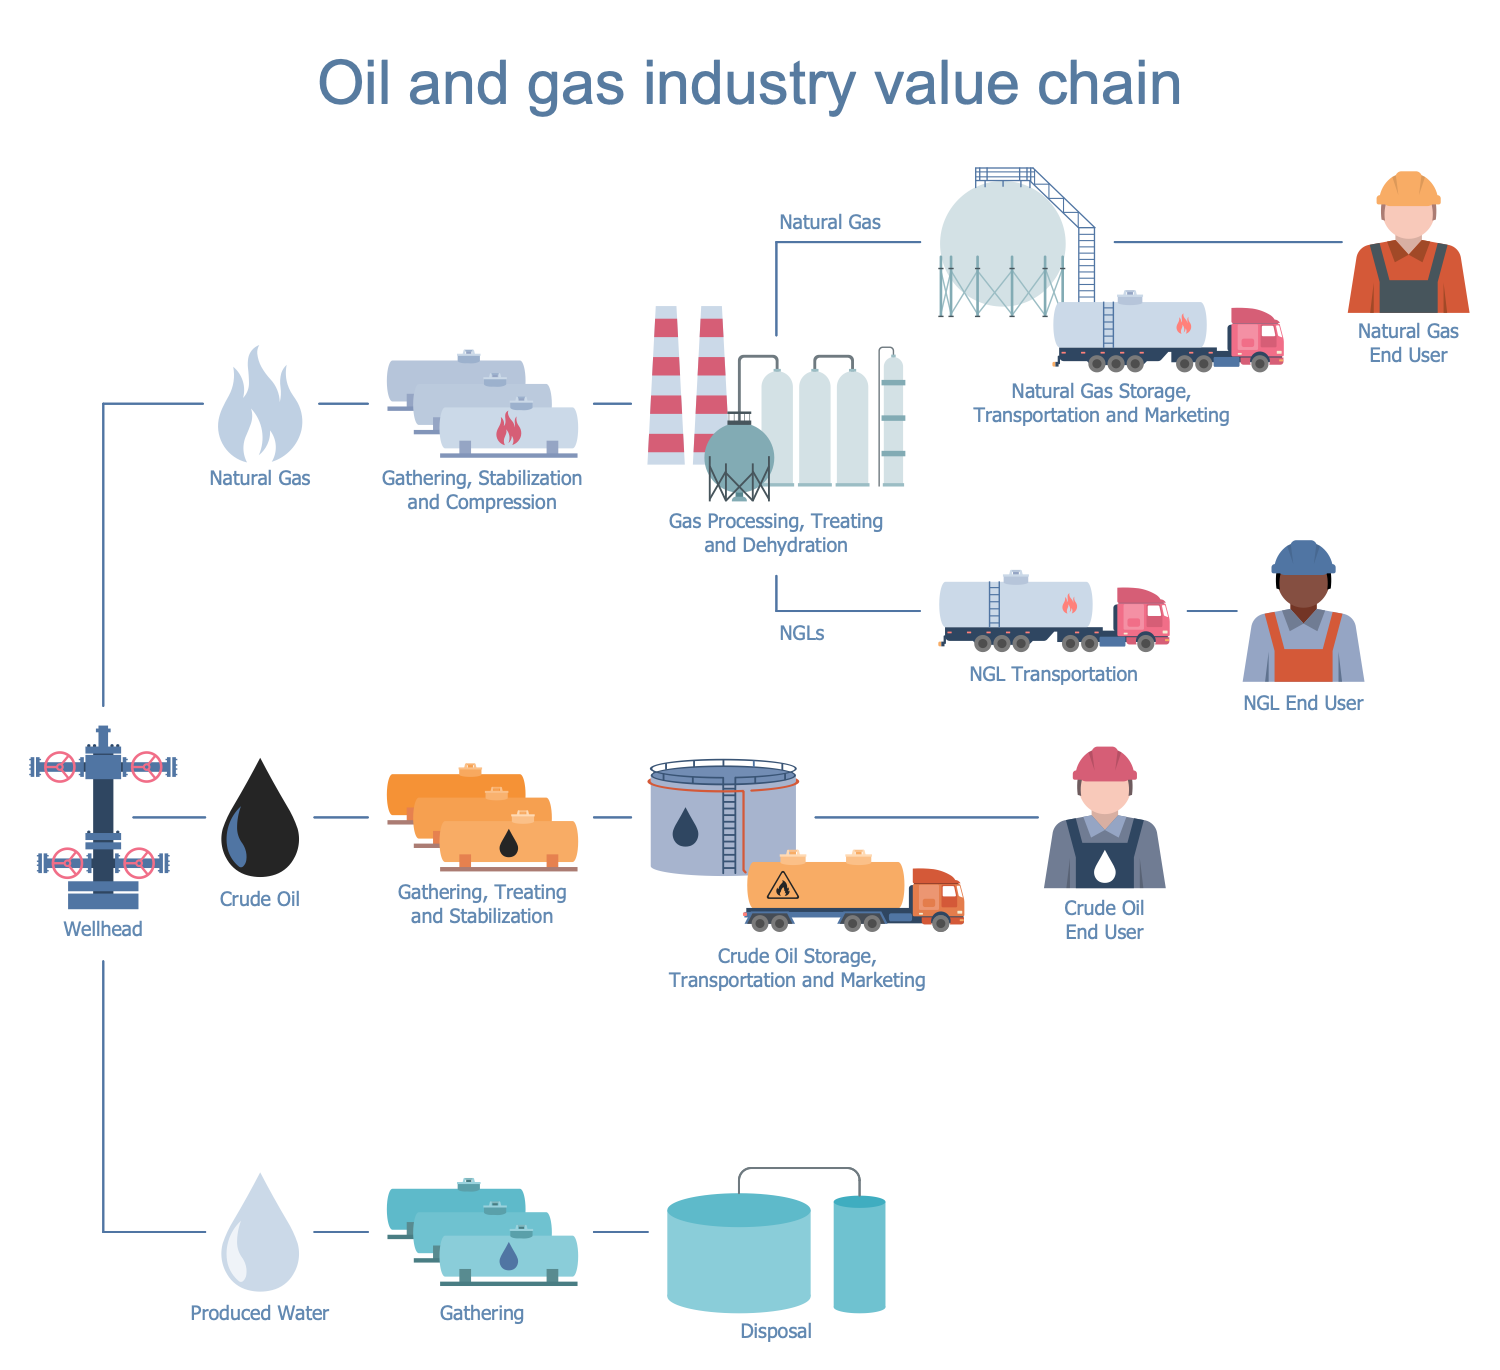
By providing visualization, you can describe different information faster, easier, more illustrative and accurately. And it doesn't matter these are statistical data, official information, facts, or your thoughts or researches. The time-saving tool Oil and Gas solution from the ConceptDraw Solution Park is a perfect solution for designing energy infographics, Oil and Gas Value Chain, oil and gas illustrations, and much more.
Design effectively with ConceptDraw DIAGRAM!

Example 2. Oil and Gas Infographics - Passenger Cars by Fuel Type
The samples you see on this page were created in ConceptDraw DIAGRAM software using the Oil and Gas Solution for ConceptDraw Solution Park. An experienced user spent 5-10 minutes creating each of these samples.
Use the Organizational Charts Solution for ConceptDraw DIAGRAM software to develop your own professional-looking diagrams related to the oil and gas industry quickly, simply, and effectively.
The possibility of exporting to a variety of popular graphical formats (PNG, JPEG, JPG, GIF, TIF, TIFF, BMP, DIB, EMF, SVG) and file formats like Microsoft PowerPoint (PPT), Adobe Acrobat (PDF), Microsoft Visio (VDX, VSDX), Adobe Flash (SWF), Encapsulated PostScript (EPS), HTML, opens wide opportunities for you.
TEN RELATED HOW TO's:
Agile methodology is an excellent alternative to waterfall and traditional sequential development. ConceptDraw DIAGRAM software extended with SCRUM Workflow solution is ideal for quick and easy designing various diagrams, charts, mind maps and schematics illustrating software development using Agile methodologies, and in particular Scrum methodology.
Picture: Agile Methodology
Related Solution:
Any information system receives data flows from external sources. In order to visualize them there is a list of data flow diagram symbols that describes how the system components cooperate. If you want to create a data flow diagram, ConceptDraw DIAGRAM Solution Park has DFD Library that contains both Yourdon and Gane-Sarson notations.
This figure shows the content of vector libraries, delivered with ConceptDraw solution for data flow diagram (DFD). There are three libraries composed from about 50 vector objects used to make data flow diagrams.
They include a complete set of objects utilized by Yourdon-Coad and Gane-Sarson notations - two primary notations that are apply for data flow diagramming. Also, one can discover additional "Data flow diagram (DFD)" library that provides a data flow diagram elements for designing level 1 and context-level data flow diagrams.
Picture: Data Flow Diagram Symbols. DFD Library
Related Solution:
There are many ways to define the flow of information within a system. Structured-systems analysis method often uses data flow diagrams to show data flow, data storages and data processing visualization. These diagrams are easy to develop and quite useful.
Here is a dataflow diagram presenting an example of the manufacturing process flow. The oval process shapes represent a process that controls data within the current system. The process may produce data or make some action based on data. Data flows are represented by lines. They show the movement of information through the system. The direction of the data flow is depicted by the arrow. The external entities are shown by rectangles. They represent the external entities interacting with the system. The data store objects (unclosed rectangles) are used to show data bases participating in a process flow.
Picture: Data Flow Diagram
Related Solution:
There are numerous articles about the advantages of flowcharting, creating business graphics and developing different charts. Nevertheless, these articles are almost useless without the main component - the examples of flowcharts, org charts and without a fine example, it is difficult to get all the conveniences of creating diagrams. You can find tons of templates and vivid examples on Solution Park.
This illustration shows a variety of business diagrams that can be created using ConceptDraw DIAGRAM. It comprises a different fields of business activities: management, marketing, networking, software and database development along with design of infographics and business illustrations. ConceptDraw DIAGRAM provides a huge set of sample drawings including business process modeling diagrams,, network diagrams, UML diagrams, orgcharts, DFD, flowcharts, ERD, geographical maps and more.
Picture: Examples of Flowcharts, Org Charts and More
Related Solution:
When we think about programming, we usually imagine sleepless nights spent on writing kilobytes of code. However, from another point of view, Software development with ConceptDraw DIAGRAM makes a programmer's life endlessly easier. This tool is unique to fulfill all your needs in short period of time.
Over the recent years object-oriented methodology has become more and more widespread. Thanks to this methodology developers manage to deal with growing complexity of applications. More and more programs are written in such programming languages as C++, Java, Visual Basic and Object Pascal. However, the complexity of the designed systems imposes extended requirements as to design of graphic documentation. ConceptDraw possesses powerful tools for designing of technical documentation for object-oriented projects. The libraries included in the package allow to easily draw class hierarchies, object hierarchies and diagrams of data flows with the use of the most popular notations, including UML and Booch notations. And the library for projecting COM-interfaces will spare developers of ActiveX-servers a headache.
Picture: Software development with ConceptDraw DIAGRAM
IT world is extremely rational and logical. So what can be more precise than Software Diagrams to rate the results of work? Visual statistics is the best way to understand the data.
This figure demonstrates the data flow diagram (DFD), which was created to describe the electronic system of custom purchase. This is the process of buying using electronic bar code scanning system. Such systems are used in large stores. The cashier scans the bar code, the system outputs the data on the price of the goods and carries out a purchase process. This DFD utilizes the Gane/Sarson notation. To create it The ConceptDraw DFD solution has been applied.
Picture: Software Diagrams
Meeting ice hockey rules one should learn ice hockey rink terms, lines, zones etc. ConceptDraw DIAGRAM is an advanced drawing software that allows you produce ice hockey rink depiction of any complexity, from simple sketch drawing to detailed one as on example below.
Picture: Ice Hockey Rink Dimensions
Related Solution:
When we start to speak about databases, we must always mention database structure visualization. One of the most common ways to do it is to create an entity relationship diagram, and to put appropriate symbols on it. It is important either for database projecting and for its' future maintenance.
Entity Relationship Diagram describes data elements and their relationships within a database. There are a set of special symbols that depict each element of an entity relationship diagram. Entities - represents some stable components such as supplier, employee, invoice, client, etc. Relation symbols show how the entities interact. Attributes define characteristics of the relationships. Attributes can be one-to-one or many-to-many. Physical symbols is used in the physical models. They represent items such as fields, tables, types and keys. ERD physical symbols are the building material for the database. Notation lines are used to illustrate the relationships. The most common method is Crow’s Feet notation. You can use ConceptDraw Entity-Relationship Diagram (ERD) solution to represent a database using the Entity-Relationship model.
Picture: Entity Relationship Diagram Symbols
Related Solution:
The SWOT Analysis solution contains easy-to-use mind map templates that help identify Strengths, Weaknesses, Opportunities, and Threats, as well as outputs to ConceptDraw DIAGRAM for presenting analysis results.
Picture: SWOT Analysis
Related Solution:
The recruitment process often requires design and use of various HR flowcharts, diagrams, attractive illustrations.
Picture: Recruitment
Related Solution:
