Economic Activities
All human activities are divided into two categories: economic activities and non-economic activities. Non-economic activities are activities not concerned with money or wealth, undertaken for the soul and out of love. In turn, economic activities are the processes based on inputs and leading to the manufacture of goods or the provision of services.
Economic activities are all activities related to producing, distributing, providing, purchasing, exchanging, selling, and consuming goods or services. It is also resource management, the use of resources and capital for producing goods and services. Also making them available to consumers to be utilized for satisfying their needs and unlimited wants. According to the sector, the economic activities are divided into categories like agriculture, industry, construction, etc.
Mostly the economic activities are driven by rationality and logic, and lead to achievement profit. The use of factors of production like land, capital, labour, entrepreneur and income generation is one of the main indicators of economic activities. The income can have different forms like salary, profit, wages, rent, royalty, and more.
Moreover, economic activities are productive and obligatory motivated by certain aspects of the production of goods and services. All activities directed at bringing the products to the market like warehousing, transporting, etc. are also productive economic activities. And even the production for self-consumption is a productive economic activity because it increases the overall supply of the market.
Economic activities exist at all levels within society. All activities we perform to earn money or things of value are economic activities. The process of production of goods and services includes combining different factors like land, labour, capital, entrepreneurship, paid rent, wages, interest, and profits. Consumption as one more economic activity consists of the use of goods and services for the satisfaction of individual or collective wants. It entails the increase of production and supply of goods and services. It also promotes competition and introduction of better products in the market. Another part of produced goods is used for capital formation. And finally, there are no economic activities without savings and investment.
Example 1. Economic Activities
There are five basic types of economic activities:
- Primary sector works with raw materials. It includes physical resources coaxed or extracted from the earth, and raw materials mined, harvested, fished, or collected. The raw materials are only obtained and later are sold to businesses in other economic sectors.
- Secondary sector includes industry and manufacturing, and transforms raw materials from the primary sector into value-added products. The manufactured products have higher value and worth than used materials due to the application of labour, intelligence, equipment, systems.
- Tertiary sector trades in information and services. For most population, it is the main sector to earn for living.
- Quaternary sector is knowledge or intellectual sector. It is built on intellectual activity and the flow of information. It includes scientific researchers, professors, internet technicians, etc.
- Fifth sector is focused on infrastructure like governments, hospitals, and non-profit agencies.

Example 2. Economy Infographics Solution in ConceptDraw STORE
The clear and precise economy infographics are easy-to-understand and especially valuable for people. Designing exceptional and precise economy infographics is incredibly easy with ConceptDraw DIAGRAM software and Economy Infographics solution.
You can start with a blank screen or one of the pre-made samples as a template. Drag and drop specialized vector design elements — economy, industries, services, and more from the solution libraries. Add textual materials about economic activities or some other on your own. Use special tools to align your objects and apply formatting tools to make your infographic looking the best.

Example 3. Main Processes of a Company
The infographics you see on this page were created in ConceptDraw DIAGRAM software using the Economy Infographics Solution and its pre-made pictograms and clipart. They successfully demonstrate the solution's capabilities and professional results you can achieve. An experienced user spent 10-15 minutes creating each of these samples.
Use the powerful tools of the Economy Infographics Solution for ConceptDraw DIAGRAM software to create your own infographics and diagrams of any complexity fast and easy, and then successfully use them in your work and personal activity.
All source documents are vector graphic documents. They are available for reviewing, modifying, or converting to a variety of formats (PDF file, MS PowerPoint, MS Visio, and many more graphic formats) from the ConceptDraw STORE. The Economy Infographics Solution is available for all ConceptDraw DIAGRAM users.
TEN RELATED HOW TO's:
Developing a software project supposes architecture first. To make it proper, you can use data flow diagram model in your current project.
The data flow diagram represents the Model of small traditional production enterprise that is made using Yourdon and Coad notation. It shows how the data is transfered through a process. According to the notation of Yourdon and Coad a process is represented by circles and data stores are drawn using parallel lines. This DFD was created using the ConceptDraw Data Flow Diagrams solution. Using this solution one can visualize data flow accordingly to the rules of two basic notations used for data flow modeling.
Picture: Data Flow Diagram Model
Related Solution:
This sample was created in ConceptDraw DIAGRAM diagramming and vector drawing software using the Flowcharts solution from the Diagrams area of ConceptDraw Solution Park.
This sample shows the Flowchart of the Subprime Mortgage Crisis. This Flowchart describes the decline in housing prices when the housing bubble burst and what it caused on the housing and financial markets. You can also see the Government and Industry responses in this crisis situation.
Picture: Flowchart on Bank. Flowchart Examples
Related Solution:
This sample was created in ConceptDraw DIAGRAM diagramming and vector drawing software using the Line Graphs Solution from Graphs and Charts area of ConceptDraw Solution Park.
This sample shows the Line Chart of annual percentage change. The Line Chart allows you to clearly see the changes of data over the time.
Picture: Line Chart Template for Word
Related Solution:
This sample shows the Business Process Reengineering Diagram. Reengineering is the process of the business processes optimizations. This sample can be used in business process management, quality management, project management and program management.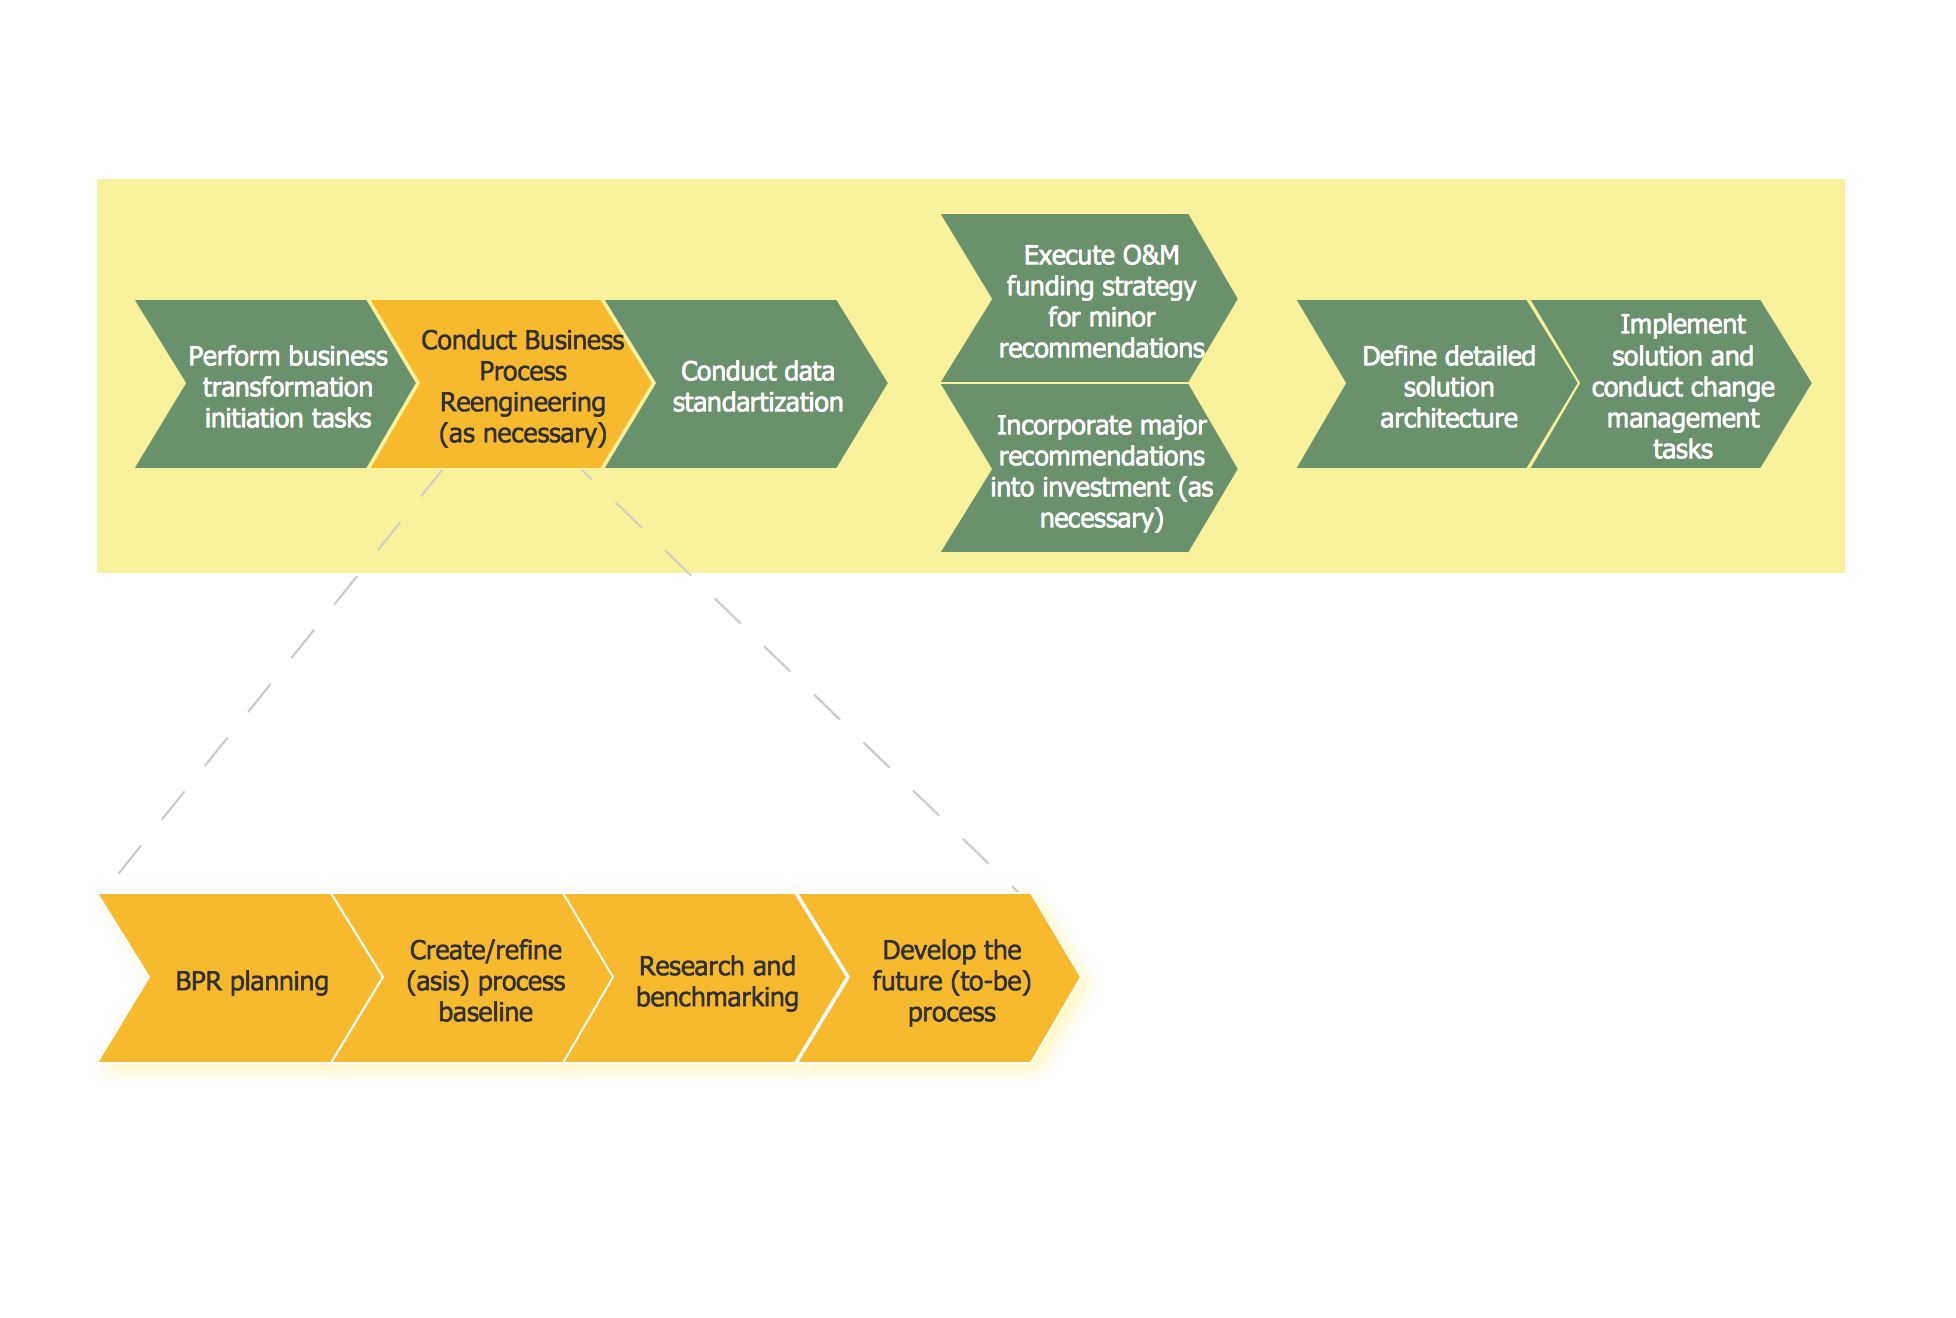
Picture: Business Process Reengineering Examples
Related Solution:
Business Process Modeling Notation -BPMN- is a set of standard symbols that allow you to create a graphical view of a business process. The symbols were developed to help users develop standard, unified structure of processes, and any messages shared between these processes. This is business process improvement tools.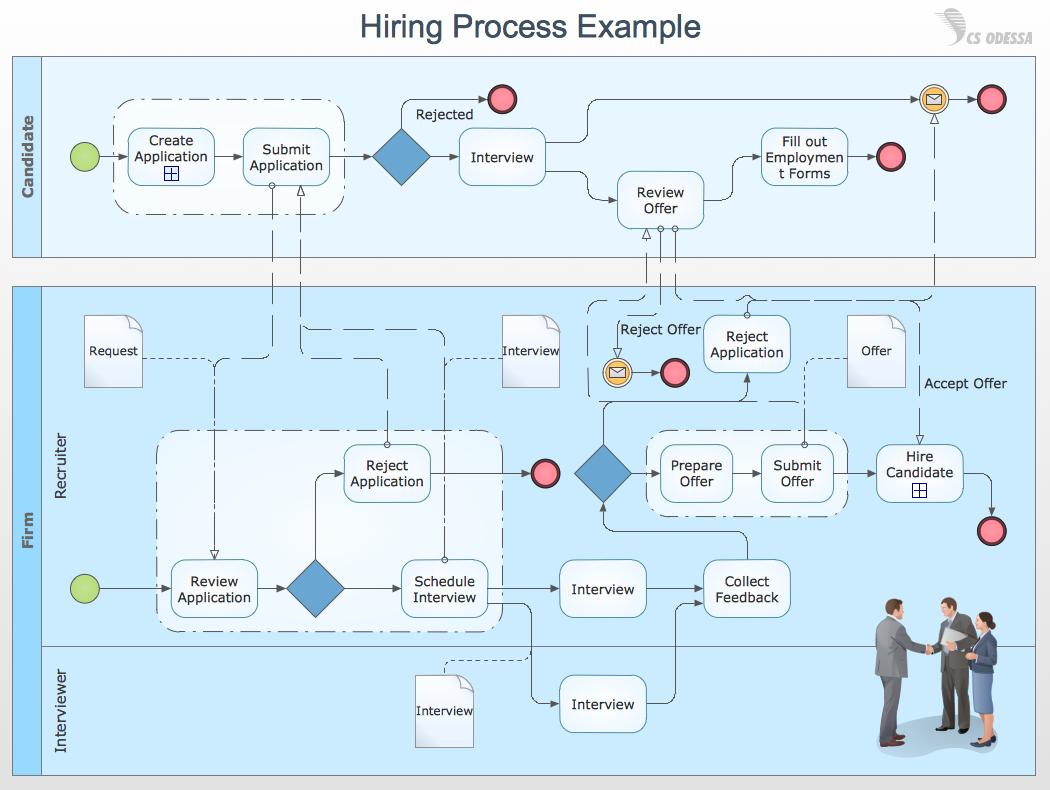
Picture: Business Process Modeling with ConceptDraw
Related Solution:
Interior design is an art of planning and coordinating the space in a building or on a floor to produce a charming and convenient environment for the client. You can ask professionals for help, or you can create floor plans easily with ConceptDraw DIAGRAM , using diverse libraries or altering numerous templates. You don’t need no formal training anymore to be a designer, isn’t it great?
Using a ConceptDraw DIAGRAM floor plan software makes depicting of home or office layout ideas a simple task. It does not require special skills to make detailed and scaled floor plans. Adding furniture to design interior is also a breeze. You can draw and furnish your floor plans with a floor plan software. Moreover, using software for floor planning you gain an opportunity to share your plans and high-resolution images of your designs with clients or stakeholders.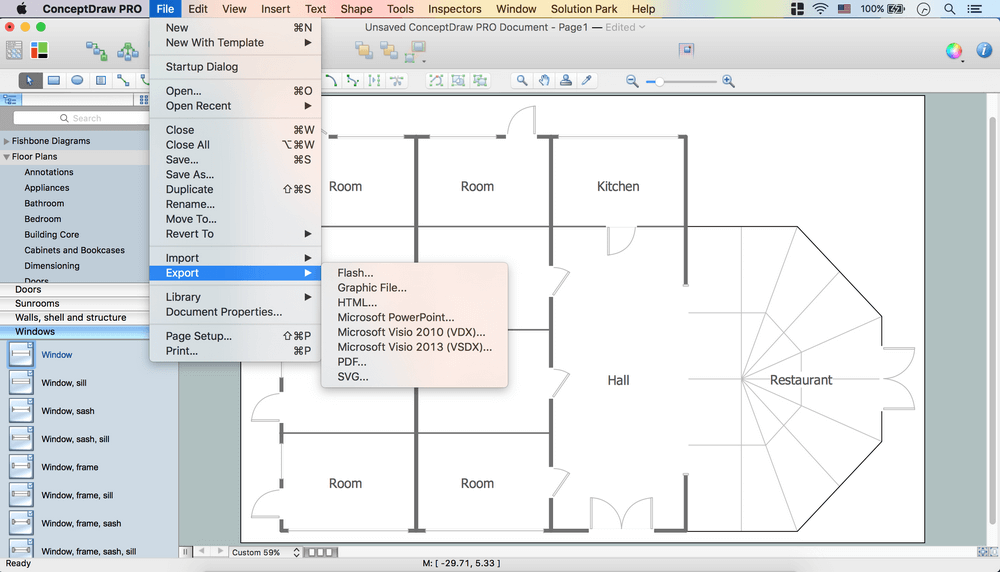
Picture:
Create Floor Plans Easily
with ConceptDraw DIAGRAM Floor Design Software
Related Solution:
Structured-systems analysis and design method uses data flow diagrams to represent the process of data flowing through a system. Talking about this might be useless without a proper example of DFD for online store (Data Flow Diagram). This DFD example shows all the distinctness that a diagram can bring into a scattered data structure.
Data flow diagrams are used to show how data is processed within some business processes. Making DFD is a common practice for business process modeling and analysis. This diagram represents the online store business flow. It describes inputs and outputs within online selling process and depicts the interactions between its participants. This DF diagram can be used by system analysts to create an overview of a business, to study and discover its inherent strengths and weak points.
Picture: Example of DFD for Online Store (Data Flow Diagram)
Related Solution:
The excellent possibility to create attractive Cross Functional Flowcharts for step-by-step visualization the operations of a business process flow of any degree of detailing is offered by ConceptDraw’s Cross-Functional Flowcharts solution. The extensive selection of commonly used vector cross functional flowchart symbols allow you to demonstrate the document flow in organization, to represent each team member’s responsibilities and how processes get shared or transferred between different teams and departments.
Picture: Cross Functional Flowchart Symbols
Related Solution:
ConceptDraw DIAGRAM is a powerful drawing and vector diagram maker software that allows to design the professional looking Influence Diagrams quick and easy.
Picture: Influence Diagram Software
Related Solution:
Mathematical Drawing Software - Draw mathematical illustration diagrams easily from examples and templates!
Picture: Basic Diagramming
Related Solution:

