Example 3. UML Object Diagram for Mac OS X

Example 4. UML Object Diagram for Windows
Examples of UML Object Diagram
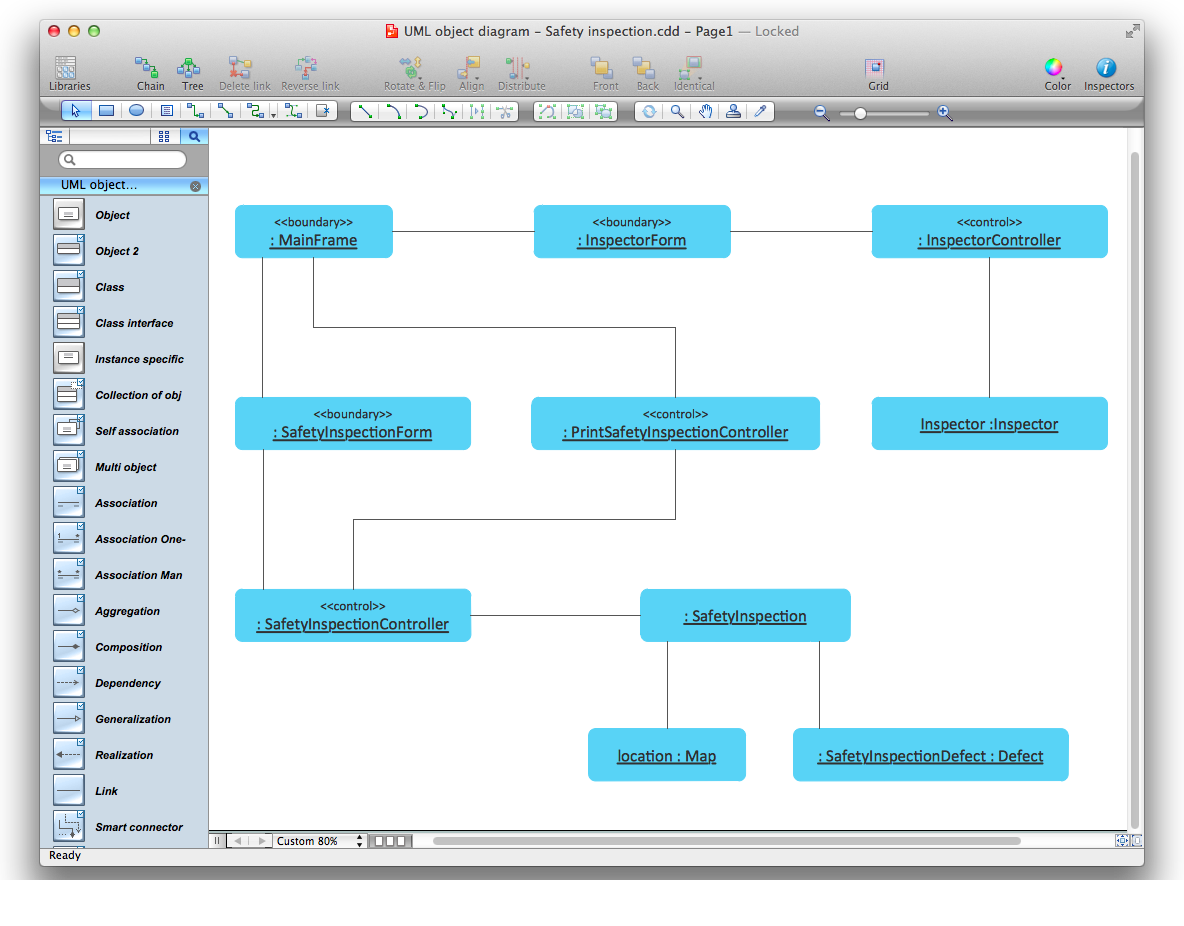
This is an example of UML Object Diagram for an Safety inspection process.

Example 5. UML Object Diagram - Safety inspection
This UML object diagram sample is created using ConceptDraw DIAGRAM diagramming and vector drawing software enhanced with Rapid UML solution from ConceptDraw Solution Park.

Example 6. UML Object Diagram Solution
Rapid UML solution provides templates, examples and libraries of stencils for quick and easy drawing the all types of system and software engineering diagrams according to UML 2.4 notation.
Use ConceptDraw DIAGRAM with UML object diagram templates, samples and stencil library from Rapid UML solution to show the particular set of system objects, their attributes and the links between them.
TEN RELATED HOW TO's:
This sample shows the Booch OOD diagram of the environment. The Booch method (developed by Grady Booch) is an object modeling language and methodology used in software engineering.
This sample was created in ConceptDraw DIAGRAM diagramming and vector drawing software using the Rapid UML Solution from the Software Development area of ConceptDraw Solution Park.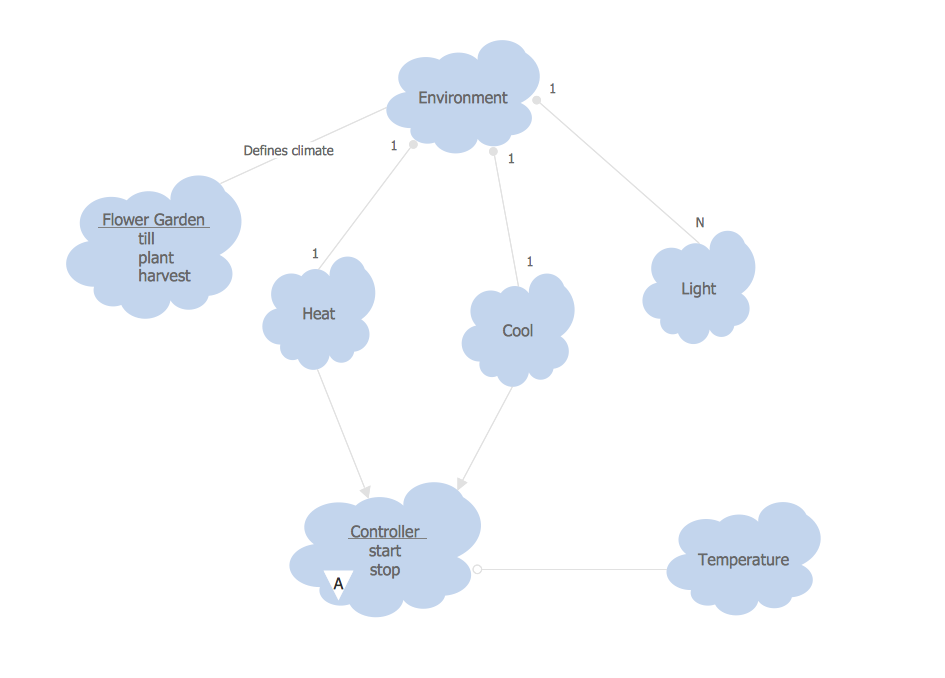
Picture: Object-Oriented Development (OOD) Method
Related Solution:
Deployment diagram describes the hardware used in system implementations and the execution environments and artifacts deployed on the hardware.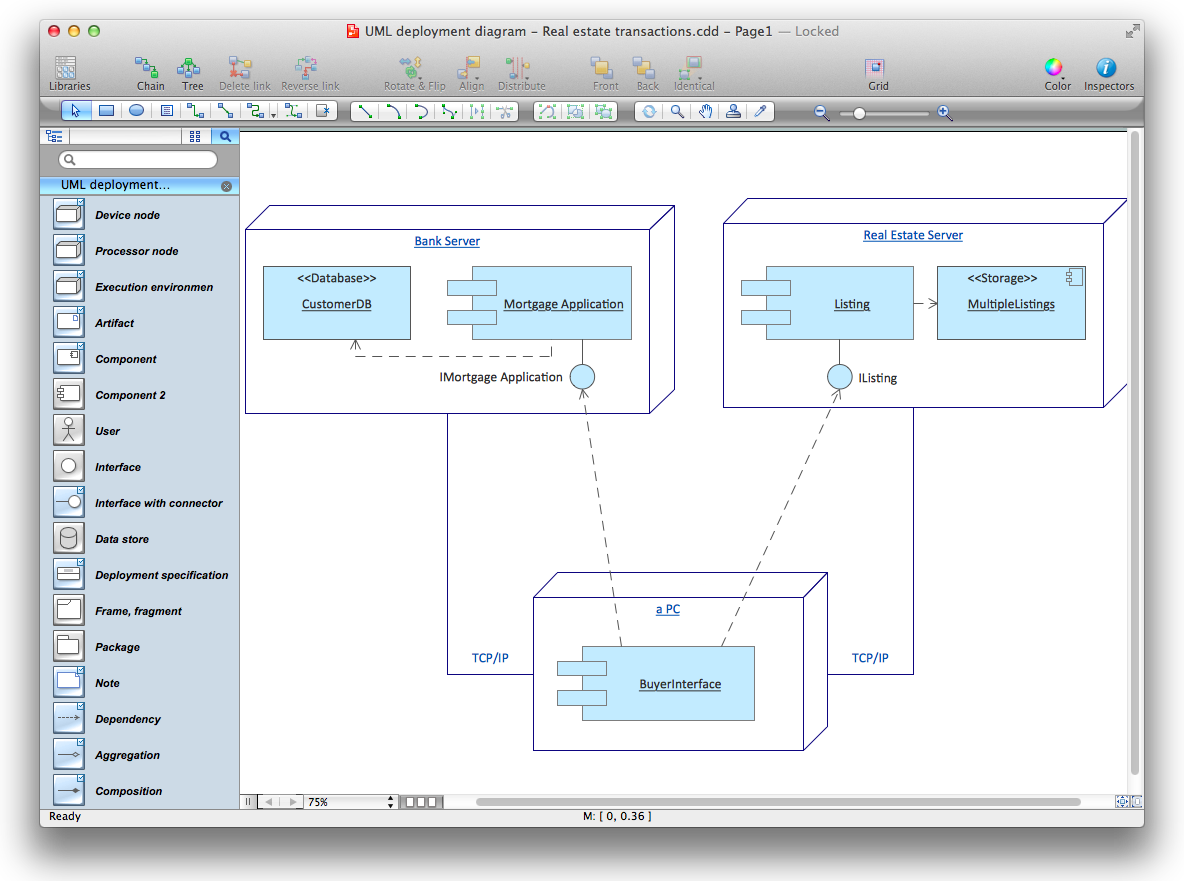
Picture: UML Deployment Diagram. Diagramming Software for Design UML Diagrams
ConceptDraw DIAGRAM software is the best Mac diagramming software for drawing any type of diagrams. Its rich set of samples and templates, and specific features to draw with great visual appeal on Mac OS X.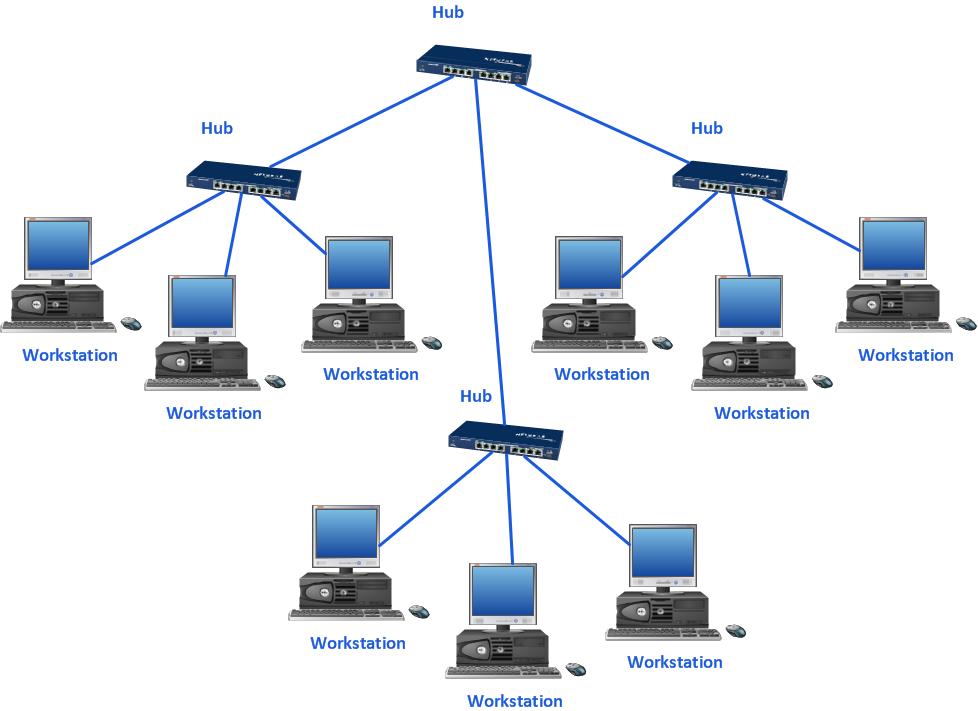
Picture: Mac Diagramming Software
A flowchart is a powerful tool for examining processes. It helps improving processes a lot, as it becomes much easier to communicate between involved people, to identify potential problems and to optimize workflow. There are flowcharts of different shapes, sizes and types of flowchart vary from quite basic process flowcharts to complex program flowcharts. Nevertheless, all these diagrams use the same set of special symbols like arrows to connect blocks, parallelogram to show data receiving or rectangles for showing process steps.
Basic flowcharts are used to represent a simple process algorithm. A basic flowchart notation consists of rectangles (business processes), arrows (the flow of information, documents, etc.). The same notation is used in items such as the "decision", which allow you to do the branching. To indicate the start of the entire business process and its termination can be used the "Terminator" element. The advantages of Basic Flowchart are simplicity and clarity. With it you can quickly describe the business process steps. Creating of Basic Flowchart does not require any special knowledge, as easily understand by employees with different levels of education and IQ.
Picture: Types of Flowchart: Comprehensive Overview
Related Solution:
ConceptDraw DIAGRAM is a powerful diagramming and vector drawing software. Extended with Website Wireframe solution from the Software Development area, ConceptDraw DIAGRAM became the ideal software for prototype and design professional looking websites wireframes. Website Wireframe solution offers at your disposal wide variety of wireframe examples and samples which confirm this.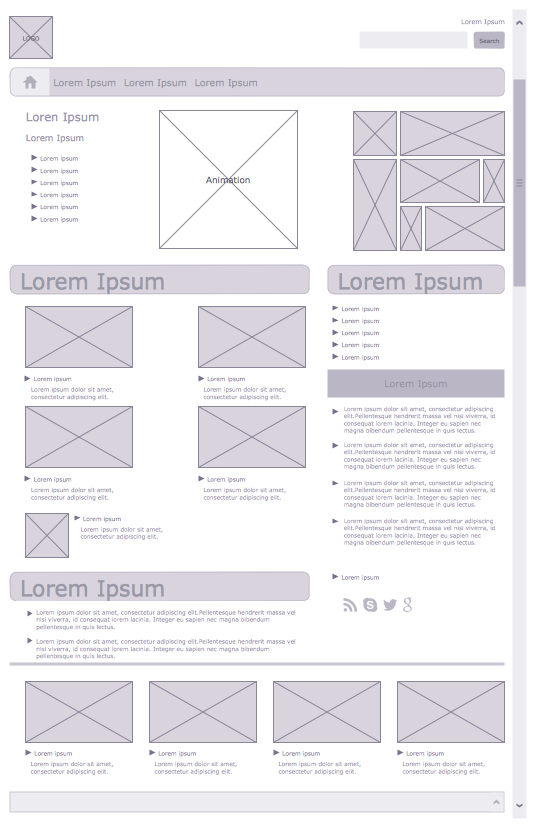
Picture: Wireframe Examples
Related Solution:
Data flow diagrams are the graphical tool, used in the visualization of data flow of some data processing systems. It is the valuable process modeling tool. Also designing DFD is the important component of the initial part of any information system development project. The standard symbols are used to represent the interaction of a system components and how various kinds of components influence on data flow. The ConceptDraw Data Flow Diagrams solution is design to assist professional software engineers in making DFDs according to Gane and Sarson, and Yourdon and Coad notations.
Do you imagine yourself as a successful IT specialist? To your mind, they all use data flow diagram examples to learn and to get inspired. Aren’t you still with us?
Picture: Data Flow Diagram Examples
Related Solution:
When thinking about the process of decision making, it's easy to imagine it as a pyramid. We will look at a three level pyramid model as an example. Operational decisions are first that come to mind, and it's the first level. Tactical and strategic decisions are the second and the third levels.
Pyramid (triangle) diagrams are used to show some hierarchical data. Because to the pyramid form of diagram, each diagram slice has a different width. The width of each segment depends on its hierarchical level.
The current image illustrates the model of information system types. Most graphically the model can be represented as a three level pyramid. The first level shows a system of transaction processing It is concentrated on operational tasks. The second level is devoted to tactical solutions of the information system management. And at least, the third level addresses strategy and represents the executive information system. This three level pyramid sample is supplied with the ConceptDraw Pyramid Diagrams solution from Marketing area of ConceptDraw Solution Park.
Picture: Pyramid Diagram
Related Solutions:
There are many tools to manage a process or to illustrate an algorithm or a workflow. Flowcharting is one of those tools. However, it may be difficult to show complex processes that require multiple attributes or several people in a simple flowchart, so a cross-functional flowchart would be a solution for that situation. To create such flowchart, group processes and steps to labeled rows or columns, and divide those groups with horizontal or vertical parallel lines. It is worth mentioning that there are different types of cross-functional flowcharts, like opportunity or deployment flowchart.
This diagram shows a cross-functional flowchart that was made for a trading process. It contains 14 processes, distributed through 5 lines depicting the participants who interact with the process. Also there are connectors that show the data flow of information between processes. The cross-functional flowchart displays a detailed model of the trading process, as well as all participants in the process and how they interact with each other. The lines in the flowchart indicates the position, department and role of the trading process participants.
Picture: Cross-Functional Flowchart
Related Solution:
Structure of a software product might get very complex and complicated, if software engineers did not pay much attention to the architecture of the product. It will take a few minutes to create UML diagrams with ConceptDraw DIAGRAM , because this software is just perfect for diagramming. You can alter ready-to-use templates, or make your own, whatever you need.
This illustration represent the example of UML diagram made by using ConceptDraw Rapid UML solution. This activity diagram displays the stages of the software development process similar to a flow chart. This diagram depicts the states of elements in the software system. It can be applied to represent software and coding logic. This UML diagram was drawn with the help of the ConceptDraw Rapid UML solution which supplies the kit of vector libraries, containing the symbols of the Unified Modeling Language notations.
Picture: UML Diagrams with ConceptDraw DIAGRAM
Related Solution:
ConceptDraw DIAGRAM diagramming and vector drawing software extended with Specification and Description Language (SDL) Solution from the Industrial Engineering Area of ConceptDraw Solution Park provides powerful drawing tools for quick and easy creating well-designed FSM diagrams.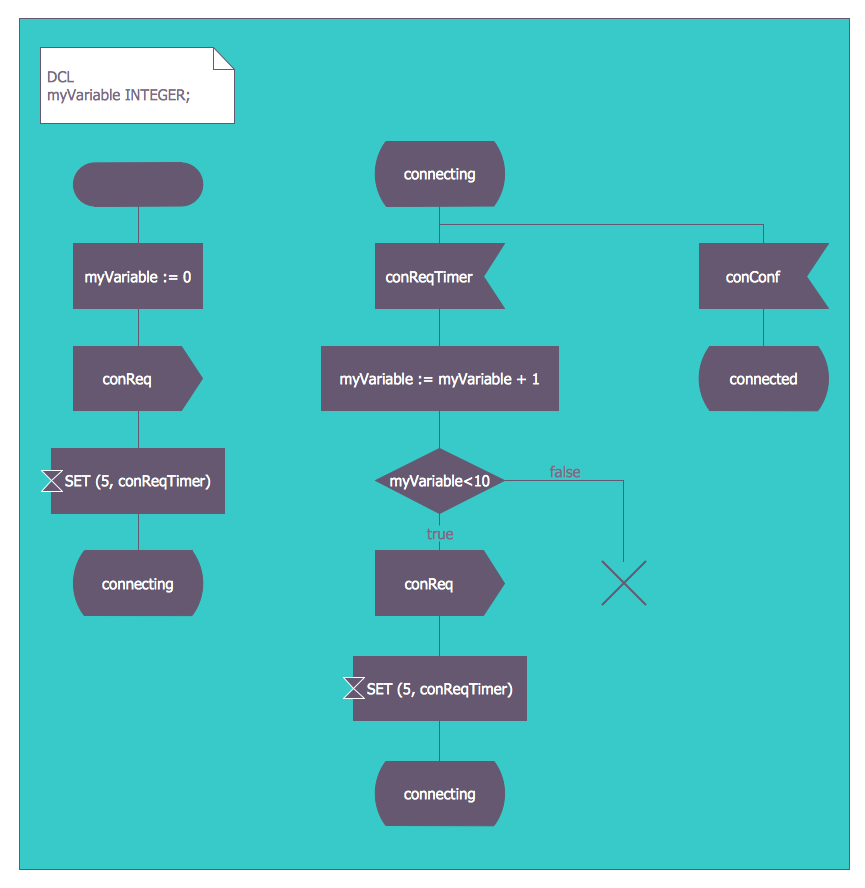
Picture: FSM — Finite-state Machine
Related Solution:


