UML Diagrams with ConceptDraw DIAGRAM
UML (Unified Modeling Language) is a general-purpose modeling language used to represent the structure of complex software in a visual form, and employed in software engineering. UML diagrams are also efficient for documenting complex computer systems and software. Such visual models facilitate communication between the customer, system analysts and programmers, who write the source code. In addition, it's much easier for new programmers to understand the source code when a detailed UML diagram of it is available. Previously, when a programmer resigned a part of his work was gone with him because the code-creating process took place exclusively in his head. Now a newcomer can understand and get familiar with someone else's code without much trouble.
Programming languages may use operations and methods which are basically same, though vary by names and graphical notations. The UML language defines standards not only for operations and methods of programming languages, but also for their terminology.
So, using UML diagrams for visual modeling will help you to improve the final software products, simplify the process of its creation and meet the deadlines.

ConceptDraw DIAGRAM is a professional software product designed for creating detailed UML diagrams. A large number of libraries with ready-made objects for UML diagrams and task-oriented templates let you create UML diagrams of any complexity without effort.
To draw a diagram, just drag the required objects from the corresponding library onto the document page, then connect them with connectors appropriate for diagrams of this type.
There are 8 types of UML diagrams:
Use case diagram:
Diagrams of this type represent a list of operations performed by the system. Such diagrams are also called functional diagrams, as the list of the system's functions is created based on them, in accordance with the specified requirements.
Use case diagrams are used to describe business processes in automated applications and to define requirement for software to be developed. They depict objects from the system and application domain as well as the tasks performed by them.

Pic.1. UML use case diagram
To draw diagrams of this type, use the UML Use Case Diagram library in ConceptDraw DIAGRAM
Deployment diagram:
UML diagrams of this type serve to analyse the hardware used in system implementations, interaction between the processor and other components. As a rule, such diagrams are used in the beginning of designing to determine the hardware configuration of the system.

Pic.2. UML deployment diagram
Use the UML Deployment Diagram library to create such diagrams in ConceptDraw DIAGRAM
Statechart diagram:
Statechart diagrams serve to model possible states of the objects in the system. They also depict the sequence of actions required for transition between the states.
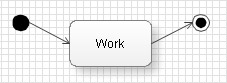
Pic.3. UML statechart diagram
Use the UML Statechart Diagram library to create such diagrams in ConceptDraw DIAGRAM
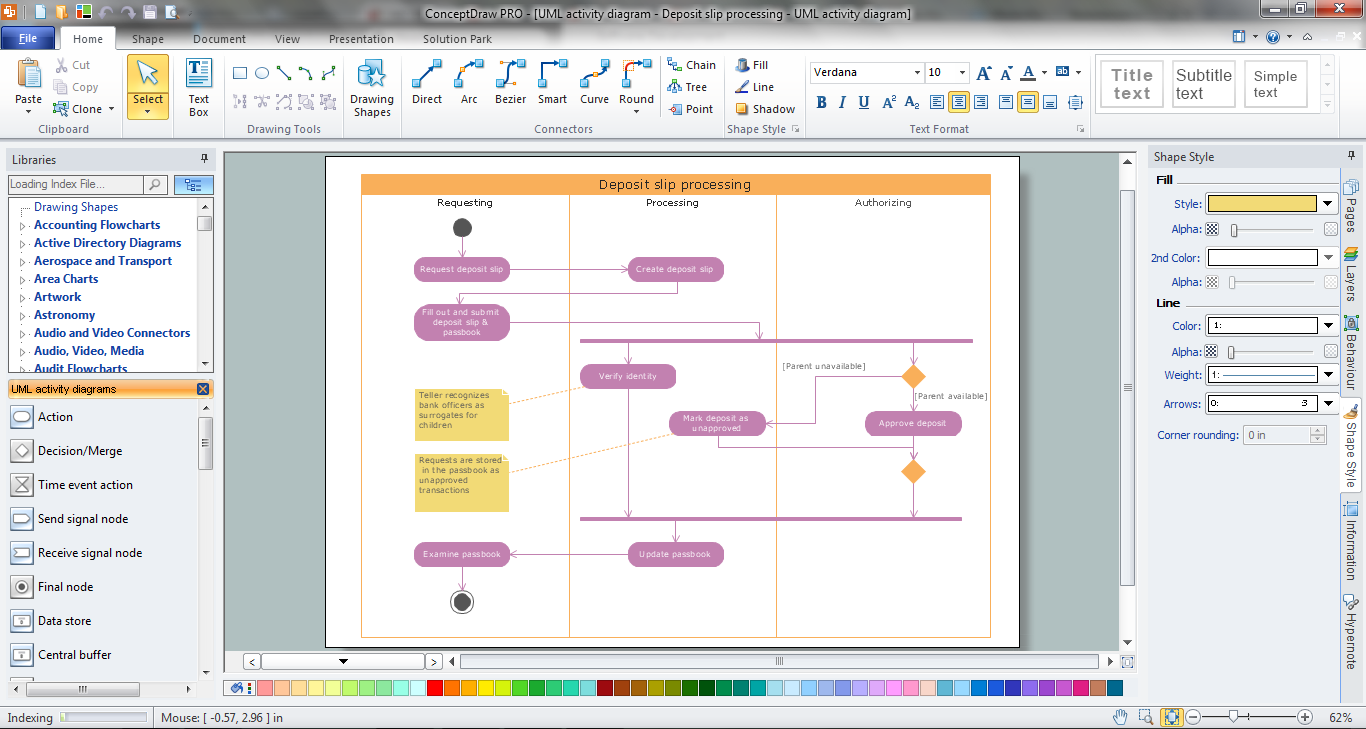
Activity diagram:
Same as Statechart diagrams, such diagrams show the states of objects in the system. The difference is that they can also depict forks for transitions from one state to another. These diagrams can be used to describe behavior algorithms of objects. You may also use them to create flow charts.

Pic.4. UML activity diagram
In ConceptDraw DIAGRAM such diagrams are represented in the UML Activity Diagram library.
Sequence diagram:
A type of interaction diagram. Sequence diagrams describe a sequence of interactions between objects.

Pic.5. UML sequence diagram
To draw such a diagram, use the UML Sequence Diagram library.
Collaboration diagram:
A collaboration diagram is also a type of interaction diagram, but unlike sequence diagrams these diagrams instead of the sequence of interactions between objects describe all variants of such interactions, regardless the sequence.

Pic.6. UML collaboration diagram
Class diagram:
They help to create graphical logical models of a system, further used to create the source code for the classes represented on the diagram.
UML class diagrams describe relationship between classes and interfaces. We recommend to create class diagrams using the Booch OOD template from the ConceptDraw STORE.

Pic.7. UML class diagram
Component diagram:
On diagrams of this type, also known as module diagrams, classes and objects are distributed by components or modules. This is very convenient for designing large systems which may count hundreds of components.

Pic.8. UML component diagram
Use the UML Component Diagram library for drawing diagrams of this type.
All libraries for creating UML diagrams are available inside the ConceptDraw DIAGRAM Templates and samples are located in the Rapid UML section of ConceptDraw STORE.

Pic.9. Rapid UML Solution in ConceptDraw STORE
TEN RELATED HOW TO's:
Cause and Effect diagram (Ishikawa diagram or Fishbone diagram) software helps you to show in one diagram the factors of Equipment, People, Process, Environment, Management and Materials, which all in general affect the overall problem and gives the base for the further analysis. ConceptDraw DIAGRAM is perfect software for designers and software developers who need to create Fishbone diagrams. You will get a simple problem-analysis tool - Fishbone software tools for design element to easy construct specific diagrams and identify many possible causes for an effect to attack complex problem solving._Win_Mac.png)
Picture: Fishbone Software Tools for Design Element
Related Solution:
Visual information is easier to perceive. You can teach even a child to make diagrams with a good flowchart example that would be interesting for it. Flowcharts can be fun, it’s not about business processes or programming algorithms.
This flowchart shows step by step process of manufacturing of Nixtamal The product which is obtained by processing maize with calcium hydroxide. We must assume that the Aztecs were very fond of this product, if the recipe of its production came to our times. This flow chart was designed using ConceptDraw DIAGRAM with its solution for designing flowcharts of various types, sizes and purposes. ConceptDraw Flowcharts solution consists from the library of flowchart symbols, containing the set vector objects. Also there are a lot of diverse templates and samples of flow charts.
Picture: Flowchart Examples and Templates
Related Solution:
Create professional business process diagrams using ConceptDraw Activities library with 34 objects from BPMN.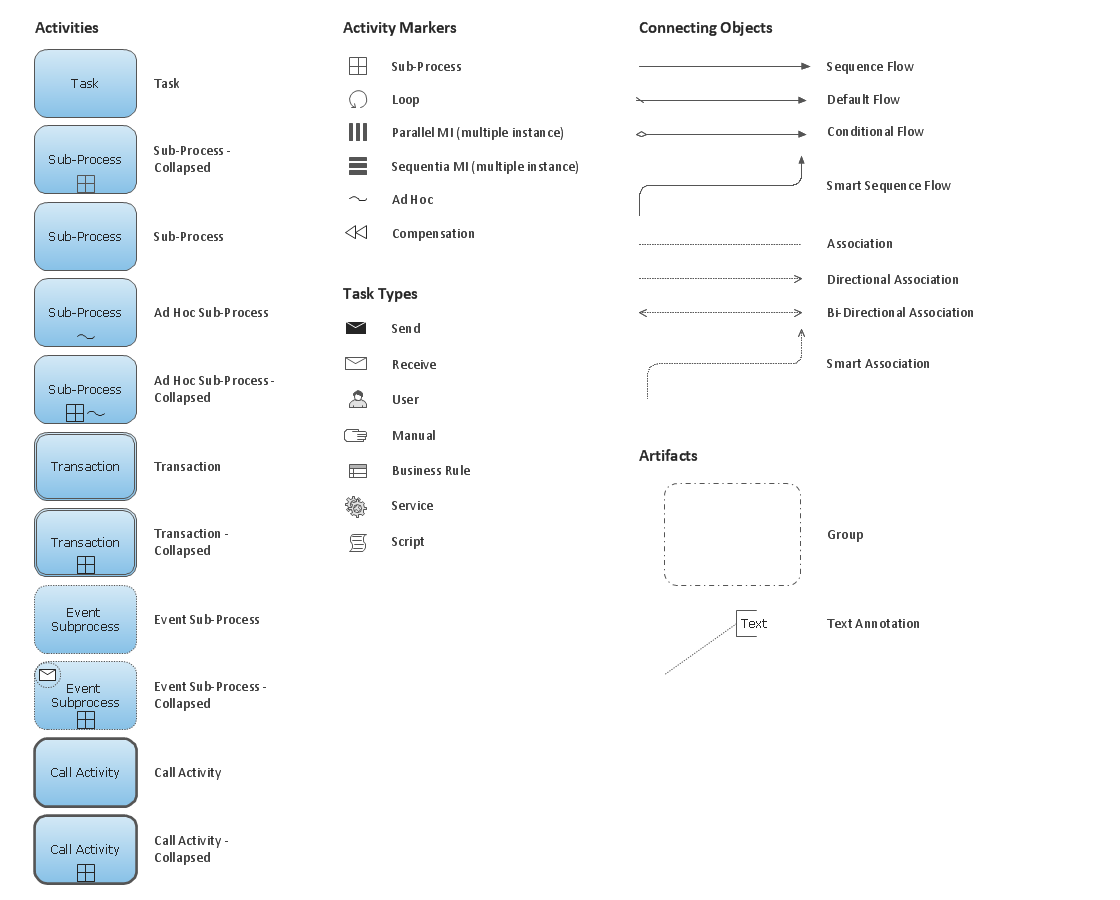
Picture: Business Process Model and Notation Elements: Activities
The popularity of Block Diagrams grows day by day. The existence of powerful software for their design is an excellent news! ConceptDraw DIAGRAM Block Diagram Software offers the Block Diagrams Solution from the Diagrams Area.
Picture: Block Diagram Software
Related Solution:
Collaborative business with ConceptDraw.
Collaborative-business strategies - the sharing of business information and ideas among partners, suppliers and customers can help increase sales, improve service, and decrease costs.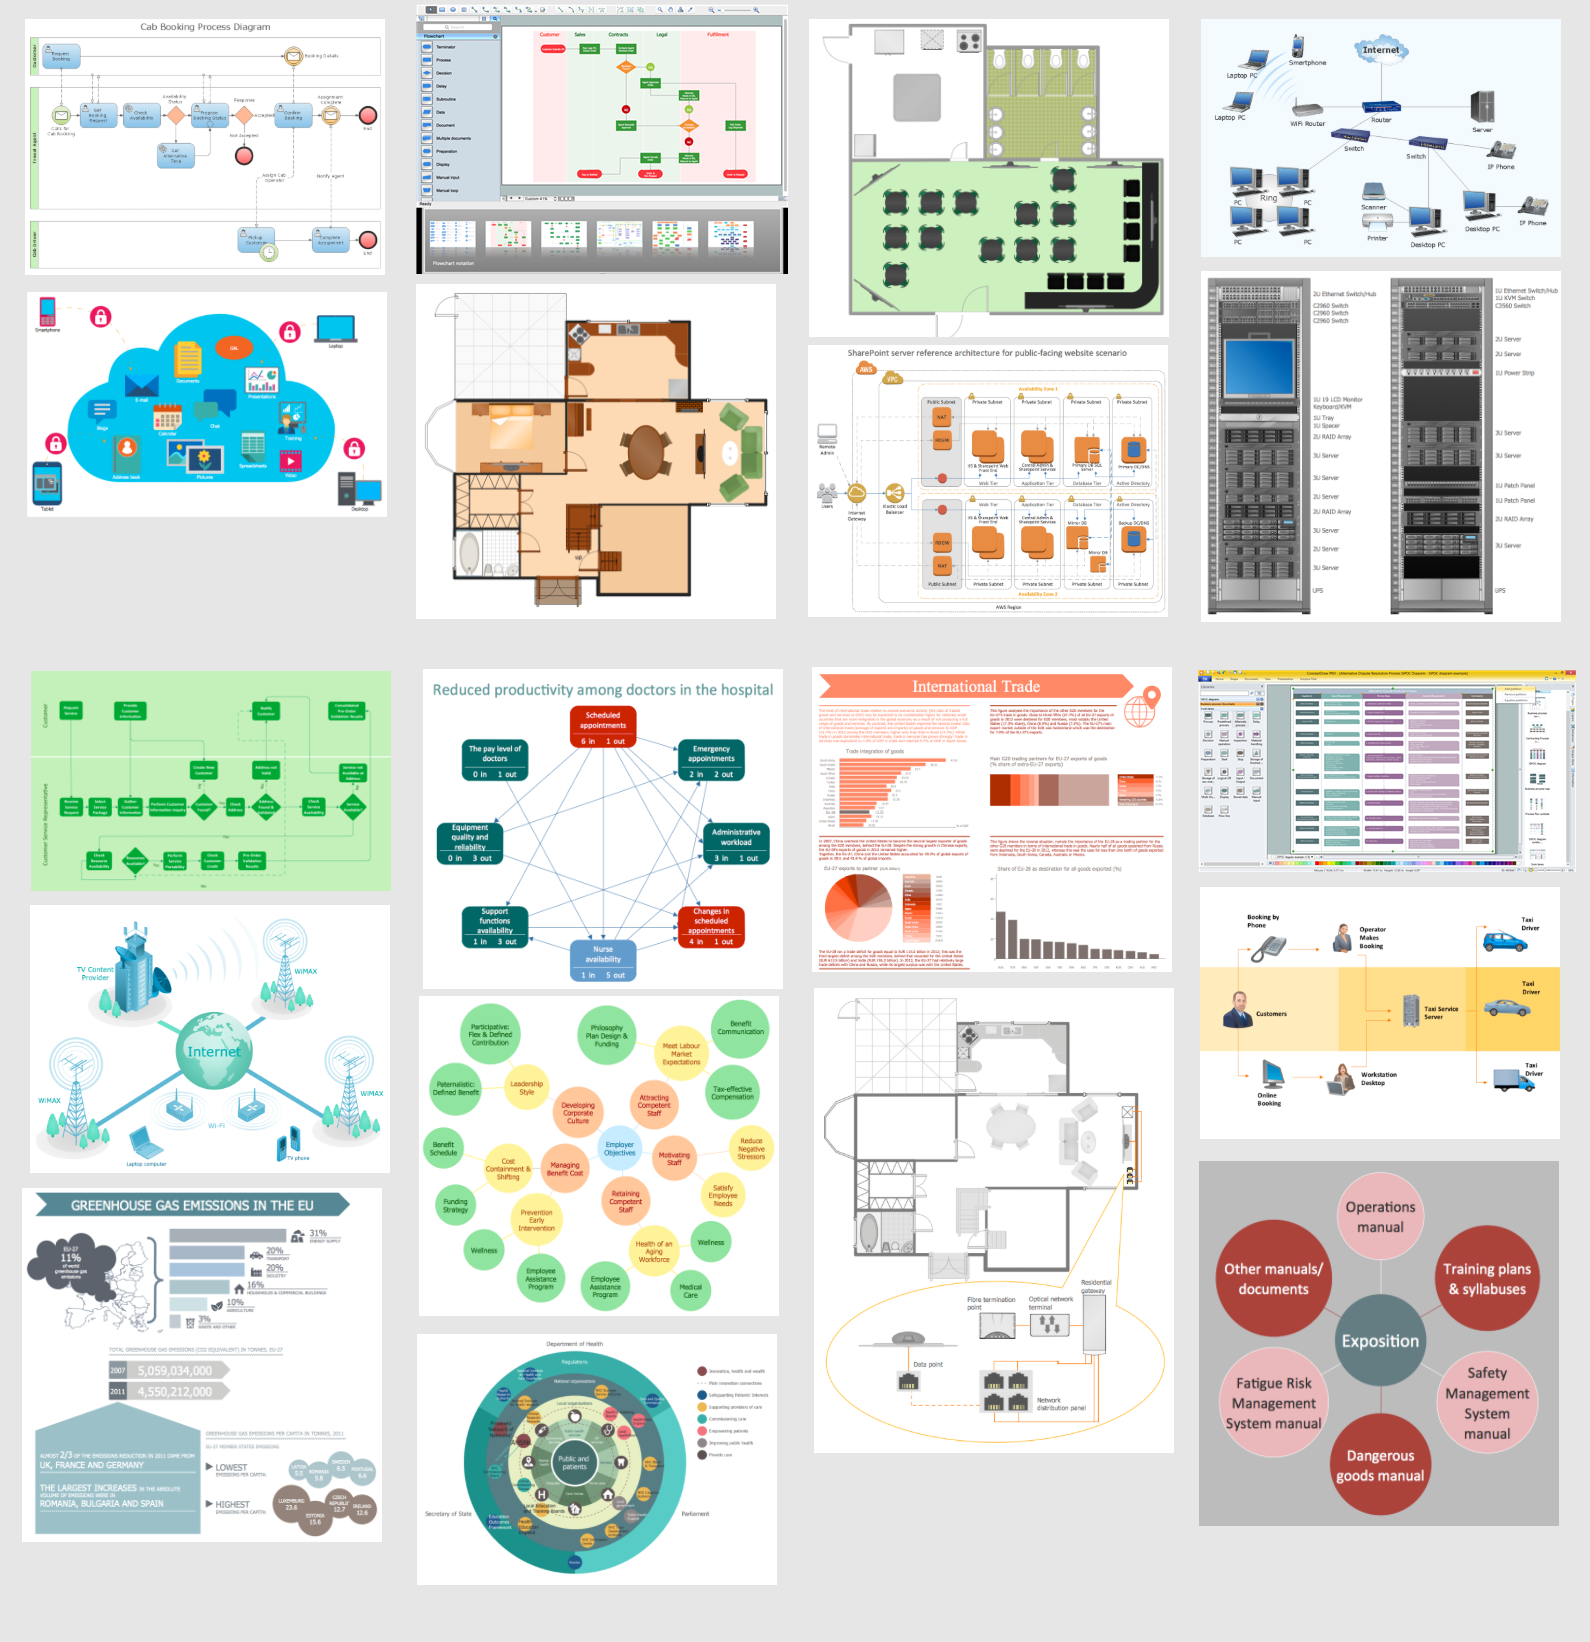
Picture: Collaborative business with ConceptDraw DIAGRAM
Electronic components have two or more electrical terminals (or leads) aside from antennas which may only have one terminal. These leads connect to create an electronic circuit with a particular function (for example an amplifier, radio receiver, or oscillator). Basic electronic components may be packaged discretely, as arrays or networks of like components, or integrated inside of packages such as semiconductor integrated circuits, hybrid integrated circuits, or thick film devices.
26 libraries of the Electrical Engineering Solution of ConceptDraw DIAGRAM make your electrical diagramming simple, efficient, and effective. You can simply and quickly drop the ready-to-use objects from libraries into your document to create the electrical diagram.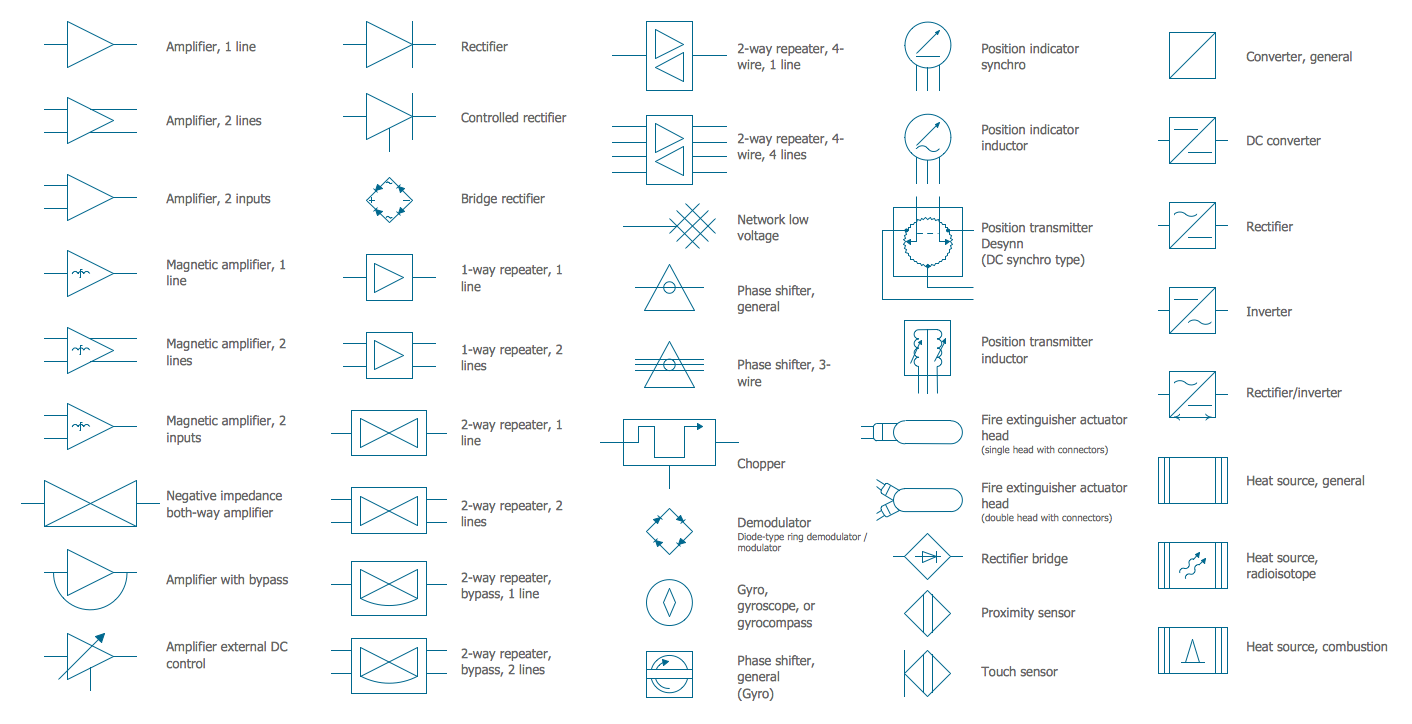
Picture: Electrical Symbols — Composite Assemblies
Related Solution:
ConceptDraw DIAGRAM diagramming and vector drawing software provides the unique Flowcharts Solution from the Diagrams Area of ConceptDraw Solution Park with variety of vector objects libraries and collection of examples Flowchart. Each example flowchart included in Flowcharts solution is a real help in drawing process, it can be the good base or perfect source of inspiration.

Picture: Examples Flowchart
Related Solution:
When it comes to system construction, a class diagram is the most widely used diagram. UML Class Diagrams is a type of static structure diagram that is used for general conceptual modeling of the systematics of the application. Such a diagram would illustrate the object-oriented view of a system. The object orientation of a system is indicated by a class diagram. It describes the structure of a system by showing the general issues,classes of a system, attributes, operations, interfaces, inheritance, and the relationships between them.
Picture: UML Class Diagram Notation
Related Solution:
In software engineering, a UML Class Diagrams is a type of static structure diagram that is used both for general conceptual modeling of the systematics of the application, and for detailed modeling translating the models into programming code.
Use ConceptDraw DIAGRAM with UML class diagram templates, samples and stencil library from Rapid UML solution to show the classes of system, their attributes, operations or methods, and the relationships among the classes.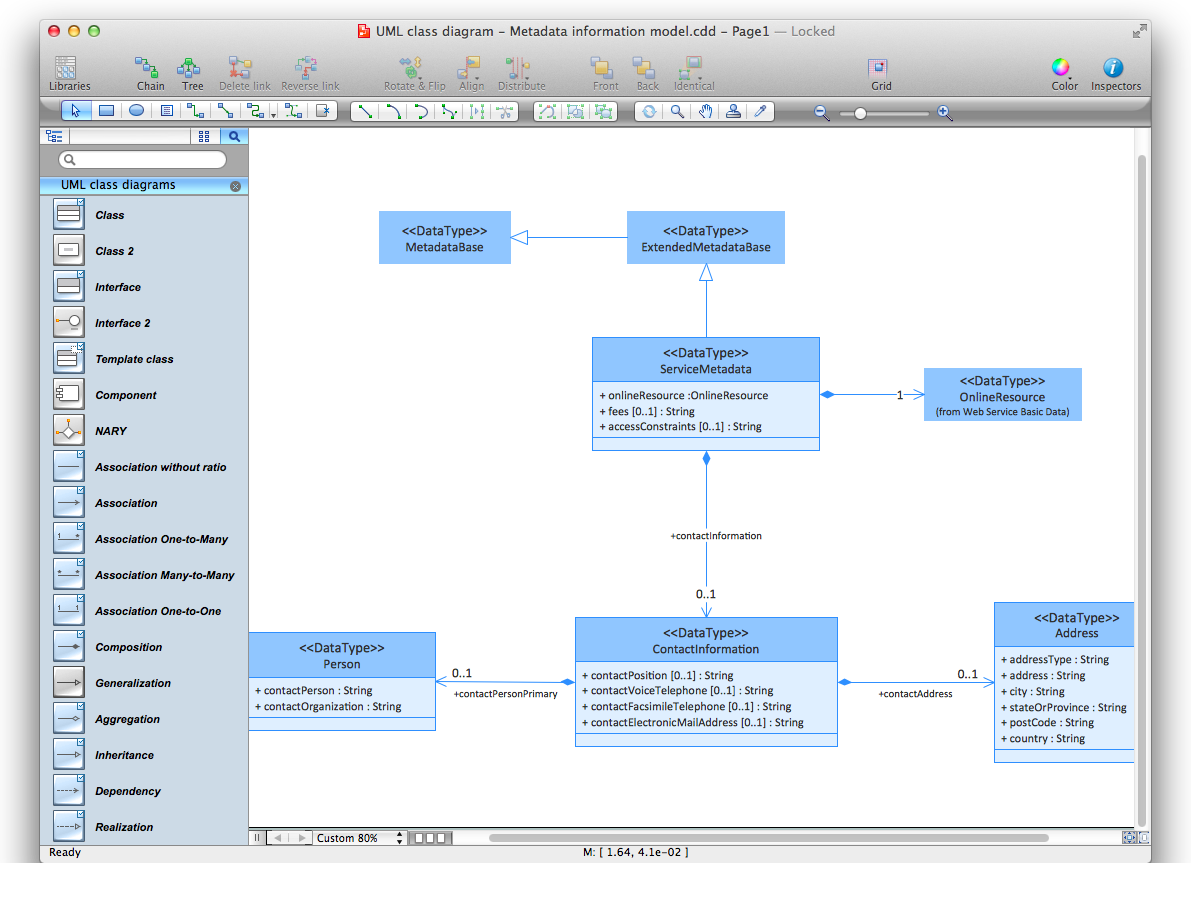
Picture: UML Class Diagrams. ConceptDraw DIAGRAM - Diagramming Software for Design UML Diagrams
Related Solution:
The Rapid UML Solution from the Software Development area of ConceptDraw Solution Park helps you to create the UML Class Diagrams quick and easy using ConceptDraw DIAGRAM diagramming and vector drawing software.
Picture: UML Class Diagram Tutorial
Related Solution:
