Context Diagram Template

This template shows the Context Diagram. It was created in ConceptDraw DIAGRAM diagramming and vector drawing software using the Block Diagrams Solution from the “Diagrams” area of ConceptDraw Solution Park.
The context diagram graphically identifies the system. external factors, and relations between them. It’s a high level view of the system. The context diagrams are widely used in software engineering and systems engineering for designing the systems that process the information.
3 Circle Venn. Venn Diagram Example

Venn Diagram Examples for Problem Solving. Computer Science. Chomsky Hierarchy

The Venn diagram example below visualizes the the class of language inclusions described by the Chomsky hierarchy.
Venn Diagram Examples for Problem Solving. Environmental Social Science. Human Sustainability Confluence

Create your Venn diagrams for problem solving in environmental social science using the ConceptDraw DIAGRAM diagramming and vector drawing software extended with the Venn Diagrams solution from the area "Diagrams" of ConceptDraw Solution Park.
Chart Maker for Presentations

Onion Diagram Maker

ConceptDraw DIAGRAM diagramming and vector drawing software extended with Stakeholder Onion Diagrams Solution from the Management Area of ConceptDraw Solution Park is a professional Onion Diagram Maker.
 Venn Diagrams
Venn Diagrams are actively used to illustrate simple set relationships in set theory and probability theory, logic and statistics, mathematics and computer science, linguistics, sociology, and marketing. Venn Diagrams are also often used to visually summarize the status and future viability of a project.
Examples of Flowcharts, Org Charts and More


 25 Typical Orgcharts
The 25 Typical Orgcharts solution contains powerful organizational structure and organizational management drawing tools, a variety of professionally designed organization chart and matrix organization structure samples, 25 templates based on various orga
EIGRP. Computer and Network Examples
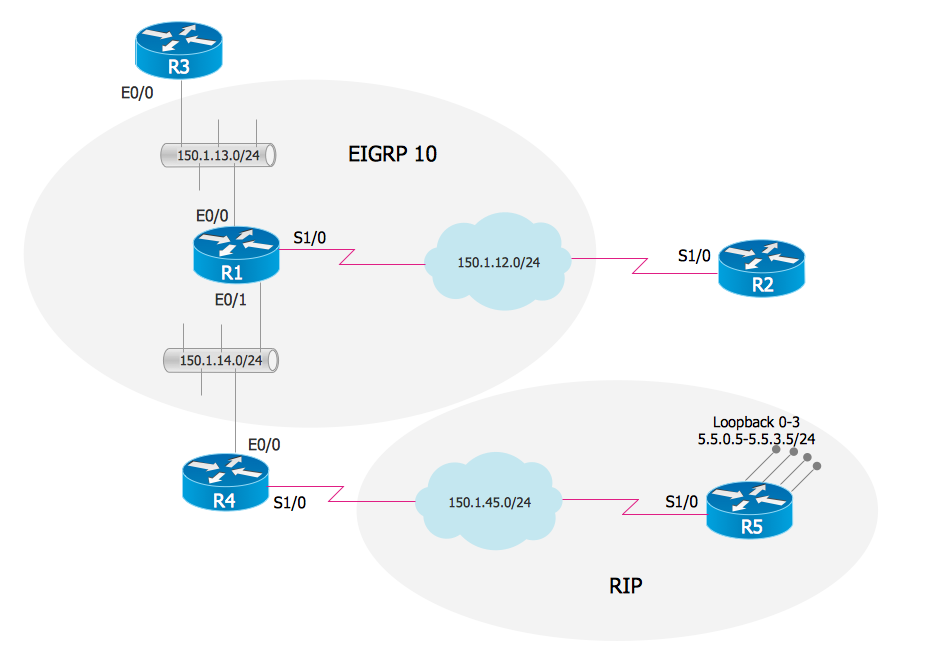
EIGRP is used to help automate routing decisions and configuration of the computer network. It allows the routers of the same logical area automatically share route information.

- Circle Spoke Diagram Template | Stakeholder Onion Diagram ...
- Community life cycle matrix - Ring chart | Bubble Diagrams | Venn ...
- Small Accounting Firm Office Layout
- Example Visio Wan Diagram Template
- Best Program to Make Diagrams | 2 Circle Venn Diagram . Venn ...
- Circle Diagrams | Circle Spoke Diagram Template | Sector diagram ...
- SWOT Analysis Tool for Small Business | Value Stream & Process ...
- Branch Diagram Maker
- Er Diagram For Small Telecom Marketing Company
- Arrow circle chart - Template | Exploded pie chart - Template | Chart ...
- ERD | Entity Relationship Diagrams, ERD Software for Mac and Win
- Flowchart | Basic Flowchart Symbols and Meaning
- Flowchart | Flowchart Design - Symbols, Shapes, Stencils and Icons
- Flowchart | Flow Chart Symbols
- Electrical | Electrical Drawing - Wiring and Circuits Schematics
- Flowchart | Common Flowchart Symbols
- Flowchart | Common Flowchart Symbols