This SWOT analysis matrix template helps you in positioning of SWOT factors as bubbles on bubble chart by size/ scale (X axis) and relevance/ importance (Y axis). The diameter of bubbles shows strategic impact of SWOT factors.
The template "SWOT analysis positioning matrix" for the ConceptDraw PRO diagramming and vector drawing software is included in the SWOT Analysis solution from the Management area of ConceptDraw Solution Park.
The template "SWOT analysis positioning matrix" for the ConceptDraw PRO diagramming and vector drawing software is included in the SWOT Analysis solution from the Management area of ConceptDraw Solution Park.
SWOT bubble chart template

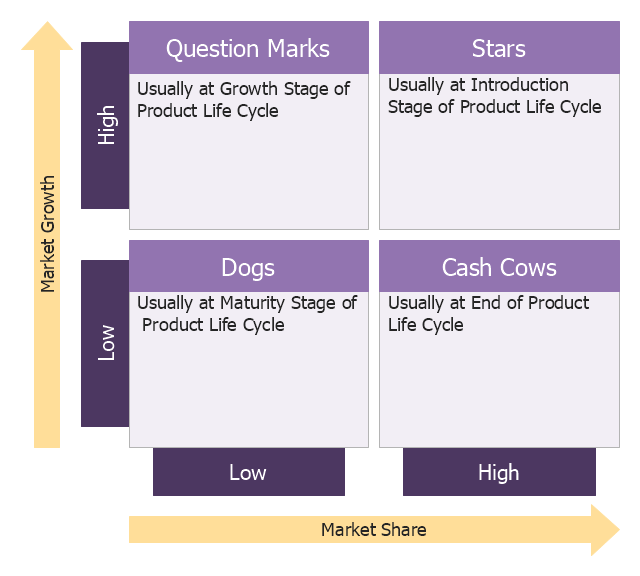
BCG Matrix helps to allocate resources, and it's used in brand marketing, product and strategic management, portfolio analysis. It assumes that an increase in relative market share will result in an increase in the cash generation, and that a growing market requires investment in assets to increase capacity and results in the cash consumption. The position of a business on the matrix provides an indication of its cash generation and consumption. The 4 categories are: Dogs; Question marks; Stars; Cash cows. The matrix is also used for resource allocation among products in a single business unit: the relative positions of the firm's business portfolio are displayed in a single diagram.
The template "Boston growth-share matrix" for the ConceptDraw PRO diagramming and vector drawing software is included in the Matrices solution from the Marketing area of ConceptDraw Solution Park.
The template "Boston growth-share matrix" for the ConceptDraw PRO diagramming and vector drawing software is included in the Matrices solution from the Marketing area of ConceptDraw Solution Park.
Boston growth share matrix template
HelpDesk
How to Make an Ansoff Matrix Template

How to Make SWOT Analysis in a Word Document

ConceptDraw products across any platform, meaning you never have to worry about compatibility again. ConceptDraw MINDMAP allows you to make SWOT analysis on PC or macOS operating systems.
Organizational Charts with ConceptDraw DIAGRAM

Business Tools Perceptual Mapping

Perception Mapping helps organizations measure and transform all aspects of their business, people and culture. Perception Mapping allows to represent the complex relationships graphically, helps identify potential problems of the organization and make the best decisions.
 Marketing
This solution extends ConceptDraw DIAGRAM and ConceptDraw MINDMAP with Marketing Diagrams and Mind Maps (brainstorming, preparing and holding meetings and presentations, sales calls).
Organogram Software

 Football
The Football Solution extends ConceptDraw DIAGRAM software with samples, templates, and libraries of vector objects for drawing football (American) diagrams, plays schemas, and illustrations. It can be used to make professional looking documen
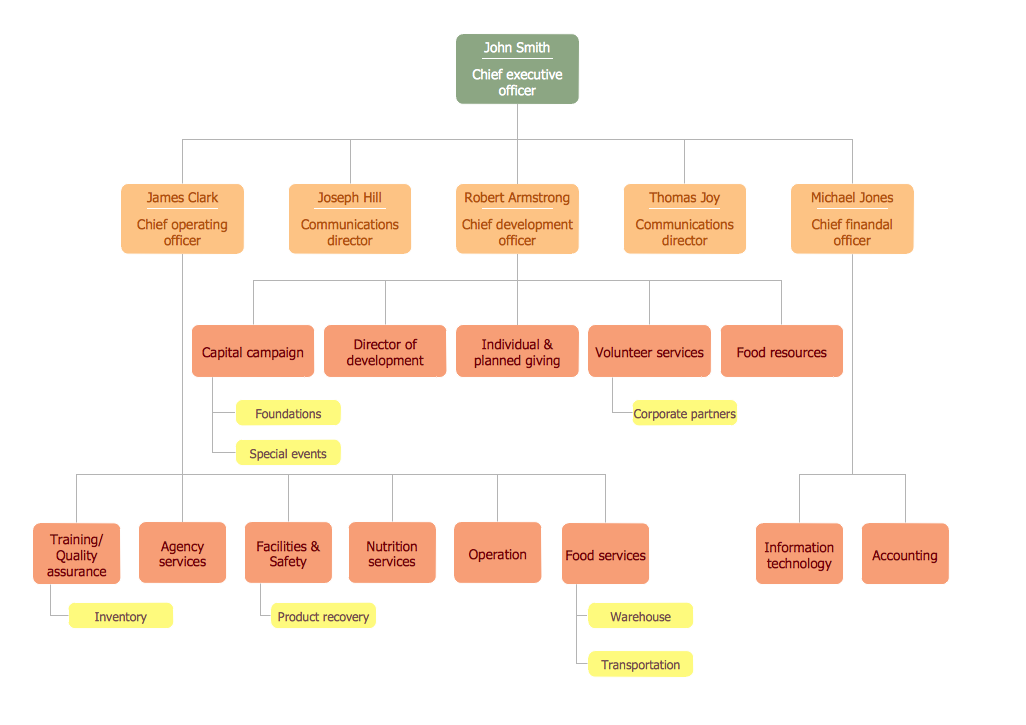
Draw Company Structure with Organization Charting Software

Draw Company Structure Diagram - get the detailed information about the company structure and hierarchy - who execute what tasks and who is in charge at this company. This information shows the reasoning and success of business and is indispensable for investors and financial institutions.
HelpDesk
How to Draw an Organizational Chart

 Management Area
The solutions from Management area of ConceptDraw Solution Park collect templates, samples and libraries of vector stencils for drawing the management diagrams and mind maps.
 Mechanical Engineering
This solution extends ConceptDraw DIAGRAM.9 mechanical drawing software (or later) with samples of mechanical drawing symbols, templates and libraries of design elements, for help when drafting mechanical engineering drawings, or parts, assembly, pneumatic,
Organigrams with ConceptDraw DIAGRAM
 Scatter Diagrams
The Scatter Diagrams solution extends ConceptDraw DIAGRAM functionality with templates, samples, and a library of vector stencils that make construction of a Scatter Plot easy. The Scatter Chart Solution makes it easy to design attractive Scatter Diagrams used in various fields of science, work, and life activities. ConceptDraw DIAGRAM lets you enter the data to the table and construct the Scatter Plot Graph automatically according to these data.
- | | Positioning Map | Positioning
- SWOT analysis positioning matrix - Template | Swot Analysis ...
- Position Matrix Marketing
- Positioning map | SWOT analysis matrix diagram templates | Swot ...
- Positioning map | Positioning Map | SWOT analysis positioning ...
- Business Tools Perceptual Mapping | Positioning map template ...
- SWOT Analysis Solution - Strategy Tools | Matrices | Pyramid Chart ...
- Positioning map | Business Tools Perceptual Mapping | Matrices ...
- SWOT analysis positioning matrix - Template | Positioning map ...
- Infield Positioning for Baseball Situations | Positioning map | SWOT ...
- Positioning map | Positioning Map | Business Tools Perceptual ...
- Positioning map | SWOT Analysis Solution - Strategy Tools ...
- SWOT analysis positioning matrix - Template | Ansoff's product ...
- Swot Analysis Examples for Mac OSX | SWOT analysis positioning ...
- Swot Analysis Examples for Mac OSX | SWOT analysis matrix ...
- Marketing | Positioning map | SWOT and TOWS Matrix Diagrams ...
- Pyramid Chart Examples | Growth-Share Matrix Software | Matrices ...
- Positioning map | GPS operation diagram | Matrices | Positioning ...
- SWOT analysis matrix diagram templates | Marketing | SWOT matrix ...
- Positioning map | Swot Analysis Examples for Mac OSX | Matrices ...
- ERD | Entity Relationship Diagrams, ERD Software for Mac and Win
- Flowchart | Basic Flowchart Symbols and Meaning
- Flowchart | Flowchart Design - Symbols, Shapes, Stencils and Icons
- Flowchart | Flow Chart Symbols
- Electrical | Electrical Drawing - Wiring and Circuits Schematics
- Flowchart | Common Flowchart Symbols
- Flowchart | Common Flowchart Symbols