Design Pictorial Infographics. Design Infographics

Sample Pictorial Chart. Sample Infographics

Infographic Maker

Spatial infographics Design Elements: Location Map

Infographic Software

Map Infographic Maker

Spatial Infographics

Pictorial Chart

How to Create a Powerful Infographic When You do not Have a Designer

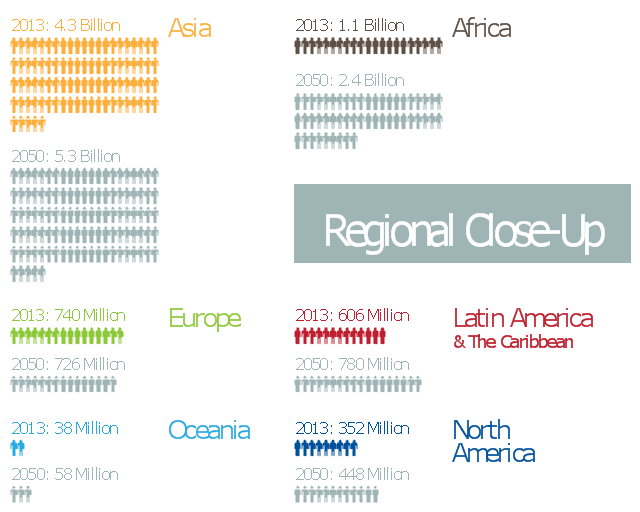
This infographic sample was created on the base of "2013 World Population. Data Sheet" from the website of Population Reference Bureau (PRB).
[prb.org/ wpds/ popup.html]
The example "World Population Infographics" was created using the ConceptDraw PRO diagramming and vector drawing software extended with the Pictorial Infographic solition from the area "What is infographics" in ConceptDraw Solution Park.
[prb.org/ wpds/ popup.html]
The example "World Population Infographics" was created using the ConceptDraw PRO diagramming and vector drawing software extended with the Pictorial Infographic solition from the area "What is infographics" in ConceptDraw Solution Park.
Infogram
Subway infographic design elements - software tools

Winter Sports. Illustrations and Visualize Statistics

Sport pictograms. Olympic Games

Travel Infographics

Information Graphics

HelpDesk
How to Create Computers and Communications Infographics

HelpDesk
How to Draw a Pictorial Chart

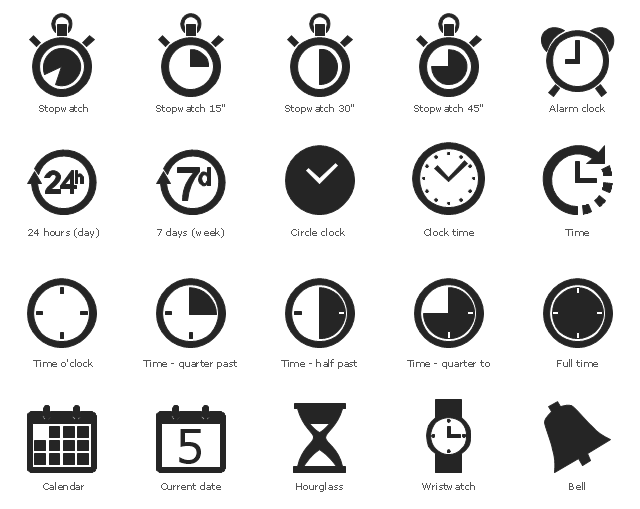
The vector stencils library "Time and clock pictograms" contains 20 time pictograms: clocks, calendars, day, week, bell, alarm clock, hourglass, wristwatch, and time intervals symbols.
Use it to create temporal infographic, illustrations and diagrams.
The pictograms example "Design elements - Time and clock pictograms" was created using the ConceptDraw PRO diagramming and vector drawing software extended with the Pictorial Infographic solution from the area "What is infographics" in ConceptDraw Solution Park.
Temporal pictograms
- Easy to Use Pictorial Infographics Solution Added to ConceptDraw ...
- Sample Pictorial Chart. Sample Infographics | Infographic Maker ...
- World Population Infographics | Sample Pictorial Chart Sample ...
- Design Pictorial Infographics . Design Infographics | Sport ...
- World Population Infographics | Sample Pictorial Chart. Sample ...
- Pictorial Chart | Infographic Maker | Sample Pictorial Chart. Sample ...
- Design Pictorial Infographics . Design Infographics | Sample Pictorial ...
- Design Pictorial Infographics . Design Infographics | Design ...
- Population growth by continent | Infographic Maker | Sample ...
- Pictorial Chart | Sample Pictorial Chart. Sample Infographics ...
- Design Pictorial Infographics . Design Infographics | Time and clock ...
- Office pictograms - Vector stencils library | Design Pictorial ...
- Design Pictorial Infographics . Design Infographics | OSHA HAZCOM ...
- How to Draw Pictorial Chart. How to Use Infograms | Infographic ...
- Information Graphics | Sample Pictorial Chart. Sample Infographics ...
- Sample Pictorial Chart. Sample Infographics | Line Chart Examples ...
- Picture Graphs | Area Chart | Infographic Maker | Population ...
- Travel Infographics | How to Create a Powerful Infographic When ...
- Education Infographics | Educational Materials | Information Graphic ...
- What are Infographic Area | How to Create an Infographic ...