"Causes in the diagram are often categorized, such as to the 6 M's ...
The 6 Ms (used in manufacturing industry):
(1) Machine (technology);
(2) Method (process);
(3) Material (Includes Raw Material, Consumables and Information.);
(4) Man Power (physical work)/ Mind Power (brain work): Kaizens, Suggestions;
(5) Measurement (Inspection);
(6) Milieu/ Mother Nature (Environment).
The original 6Ms used by the Toyota Production System have been expanded by some to include the following and are referred to as the 8Ms. However, this is not globally recognized. It has been suggested to return to the roots of the tools and to keep the teaching simple while recognizing the original intent; most programs do not address the 8Ms.
(7) Management/ Money Power;
(8) Maintenance." [Ishikawa diagram. Wikipedia]
This 8Ms Ishikawa diagram (manufacturing cause and effect diagram) template is included in the Fishbone Diagram solution from the Management area of ConceptDraw Solution Park.
8Ms Ishikawa diagram

Ishikawa Diagram

HelpDesk
How to Create a Fishbone (Ishikawa) Diagram Quickly
 Diagram Quickly")
This cause-and-effect diagram example was redesigned from the Wikimedia Commons file: Ishikawa Fishbone Diagram.svg. [commons.wikimedia.org/ wiki/ File:Ishikawa_ Fishbone_ Diagram.svg]
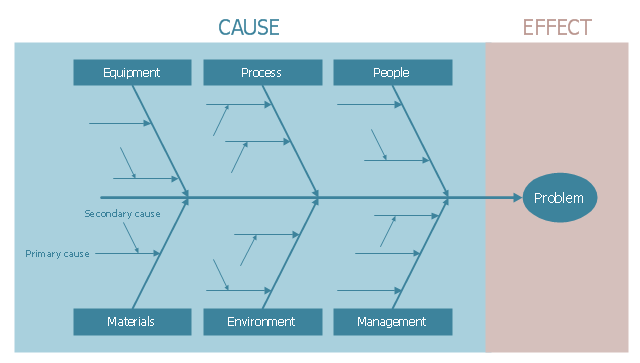
"Ishikawa diagrams (also called fishbone diagrams, herringbone diagrams, cause-and-effect diagrams, or Fishikawa) are causal diagrams created by Kaoru Ishikawa (1968) that show the causes of a specific event. Common uses of the Ishikawa diagram are product design and quality defect prevention to identify potential factors causing an overall effect. Each cause or reason for imperfection is a source of variation. Causes are usually grouped into major categories to identify these sources of variation. The categories typically include
- People: Anyone involved with the process
- Methods: How the process is performed and the specific requirements for doing it, such as policies, procedures, rules, regulations and laws
- Machines: Any equipment, computers, tools, etc. required to accomplish the job
- Materials: Raw materials, parts, pens, paper, etc. used to produce the final product
- Measurements: Data generated from the process that are used to evaluate its quality
- Environment: The conditions, such as location, time, temperature, and culture in which the process operates" [Ishikawa diagram. Wikipedia]
The example "Ishikawa fishbone diagram" was created using the ConceptDraw PRO software extended with the Seven Basic Tools of Quality solution from the Quality area of ConceptDraw Solution Park.
Cause-and-effect diagram example
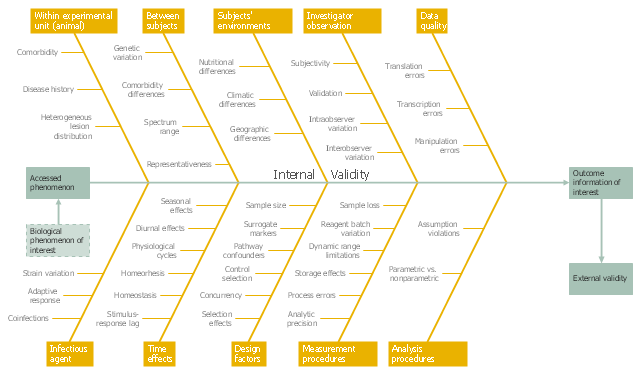
This example was created on the base of the figure from the website of the WSU College of Veterinary Medicine of the Washington State University. [vetmed.wsu.edu/ courses-jmgay/ images/ Ishikawa%20 Variance%20 Diagram.jpg]
"Internal validity is a property of scientific studies which reflects the extent to which a causal conclusion based on a study is warranted. Such warrant is constituted by the extent to which a study minimizes systematic error (or 'bias')." [Internal validity. Wikipedia]
The fishbone diagram example "Ishikawa variance diagram" was created using the ConceptDraw PRO diagramming and vector drawing software extended with the Fishbone Diagrams solution from the Management area of ConceptDraw Solution Park.
Ishikawa diagram
Fishbone Diagram Problem Solving

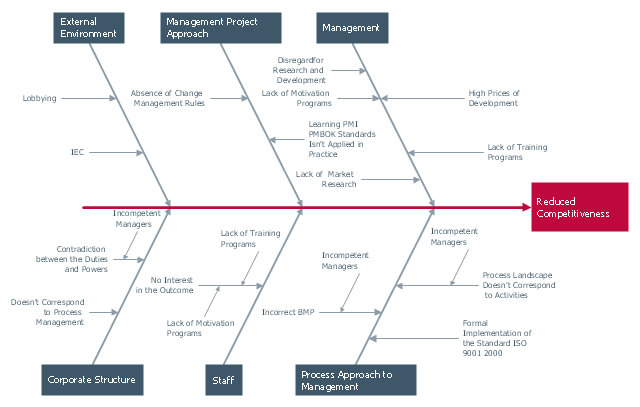
"Cause-and-effect diagrams can reveal key relationships among various variables, and the possible causes provide additional insight into process behavior.
Causes can be derived from brainstorming sessions. These groups can then be labeled as categories of the fishbone. They will typically be one of the traditional categories mentioned above but may be something unique to the application in a specific case. Causes can be traced back to root causes with the 5 Whys technique." [Ishikawa diagram. Wikipedia]
The Ishikawa diagram (cause and effect diagram, fishbone diagram) example "Factors reducing competitiveness" was created using the ConceptDraw PRO diagramming and vector drawing software extended with the Fishbone Diagrams solution from the Management area of ConceptDraw Solution Park.
Ishikawa diagram
HelpDesk
How to Add a Fishbone (Ishikawa) Diagram to an MS Word Document
 Diagram to an MS Word Document *")
When To Use a Fishbone Diagram

How Do Fishbone Diagrams Solve Manufacturing Problems

HelpDesk
How To Create Cause and Effect (Fishbone) Diagram in MS Visio
 Diagram in MS Visio")
Fishbone Diagram Design Element
.png "Fishbone Diagram Design Element *")
Fishbone Diagram Example

This example was created on the base of the figure from the website of the Iowa State University Center for Excellence in Learning and Teaching.
"Fishbone.
What: The fishbone technique uses a visual organizer to identify the possible causes of a problem.
Benefits: This technique discourages partial or premature solutions and demonstrates the relative importance of, and interactions between, different parts of a problem.
How: On a broad sheet of paper, draw a long arrow horizontally across the middle of the page pointing to the right. Label the arrowhead with the title of the issue to be explained. This is the "backbone" of the "fish." Draw "spurs" from this "backbone" at about 45 degrees, one for every likely cause of the problem that the group can think of; and label each. Sub-spurs can represent subsidiary causes. The group considers each spur/ sub-spur, taking the simplest first, partly for clarity but also because a simple explanation may make more complex ones unnecessary. Ideally, the fishbone is redrawn so that position along the backbone reflects the relative importance of the different parts of the problem, with the most important at the head." [celt.iastate.edu/ creativity/ techniques.html]
The fishbone diagram example "Inability to meet project deadlines" was created using the ConceptDraw PRO diagramming and vector drawing software extended with the Fishbone Diagrams solution from the Management area of ConceptDraw Solution Park.
Ishikawa diagram

"Causes in the diagram are often categorized, such as to the 6 M's ...
The 6 Ms (used in manufacturing industry)
- Machine (technology)
- Method (process)
- Material (Includes Raw Material, Consumables and Information.)
- Man Power (physical work)/ Mind Power (brain work): Kaizens, Suggestions
- Measurement (Inspection)
- Milieu/ Mother Nature (Environment)
The original 6Ms used by the Toyota Production System have been expanded by some to include the following and are referred to as the 8Ms. However, this is not globally recognized. It has been suggested to return to the roots of the tools and to keep the teaching simple while recognizing the original intent; most programs do not address the 8Ms.
- Management/ Money Power
- Maintenance" [Ishikawa diagram. Wikipedia]
The 4Ms fishbone diagram (cause and effect diagram, Ishikawa diagram) example "Production process" was created using the ConceptDraw PRO diagramming and vector drawing software extended with the Fishbone Diagrams solution from the Management area of ConceptDraw Solution Park.
4Ms Ishikawa diagram

The library of vector stencils "Fishbone diagrams" contains 13 symbols for drawing the Ishikawa diagrams using the ConceptDraw PRO diagramming and vector drawing software.
"Ishikawa diagrams were popularized by Kaoru Ishikawa in the 1960s, who pioneered quality management processes in the Kawasaki shipyards, and in the process became one of the founding fathers of modern management.
The basic concept was first used in the 1920s, and is considered one of the seven basic tools of quality control. It is known as a fishbone diagram because of its shape, similar to the side view of a fish skeleton." [Ishikawa diagram. Wikipedia]
"The Seven Basic Tools of Quality is a designation given to a fixed set of graphical techniques identified as being most helpful in troubleshooting issues related to quality. They are called basic because they are suitable for people with little formal training in statistics and because they can be used to solve the vast majority of quality-related issues.
The seven tools are:
(1) Cause-and-effect diagram (also known as the "fishbone" or Ishikawa diagram);
(2) Check sheet;
(3) Control chart;
(4) Histogram;
(5) Pareto chart;
(6) Scatter diagram;
(7) Stratification (alternately, flow chart or run chart)." [Seven Basic Tools of Quality. Wikipedia]
The example "Design elements - Fishbone diagram" is included in the Fishbone Diagrams solution from the Management area of ConceptDraw Solution Park.
Ishikawa diagram symbols

Draw Fishbone Diagram on MAC Software

Fishbone Diagram Template

How to Construct a Fishbone Diagram

Fishbone Diagram

- Manufacturing 8 Ms fishbone diagram - Template | Ishikawa ...
- How to Create a Fishbone ( Ishikawa ) Diagram Quickly | Draw ...
- Fishbone Diagrams | Blank Calendar Template | Cause and Effect ...
- Ishikawa fishbone diagram | Fishbone diagram - Bad coffee | Cause ...
- What Is Difference Between Fta And Ishikawa
- Fishbone Diagrams | Examples Of Ishikawa Diagram In ...
- Fishbone Diagram Example | Ishikawa Diagram | How Do Fishbone ...
- Manufacturing 8 Ms fishbone diagram - Template | 7ms Ishikawa
- Fishbone Diagrams | How Do Fishbone Diagrams Solve ...
- Ishikawa Diagram In Food Processing
- How to Add a Fishbone ( Ishikawa ) Diagram to a MS Word Document ...
- Design elements - Process flowchart | How to Create a Fishbone ...
- Ishikawa Diagram | Cause and Effect Diagram | Auditing Process ...
- Ishikawa 7m
- Fishbone Diagram Problem Solving | Human Resource ...
- Fishbone Diagram Problem Solving | Ishikawa Diagram | Fishbone ...
- Fishbone Diagrams | Fishbone Diagram | Ishikawa Diagram ...
- Ishikawa Diagram
- How to Create a Fishbone ( Ishikawa ) Diagram Quickly | How To ...
- Fault Tree Analysis Diagrams | Fishbone Diagrams | Fishbone ...