This site uses cookies. By continuing to browse the ConceptDraw site you are agreeing to our Use of Site Cookies.
HelpDesk

How to Create Organizational Chart Using Management Solution

Use ConceptDraw MINDMAP for generating structured data on organization structure and then ConceptDraw PRO for presenting the results as chart.
HelpDesk

How to Draw an Organizational Chart Using ConceptDraw PRO

The organizational chart software is a valuable tool for modern business. It is important for any business to build a clear organizational structure that determines the responsibilities and relationships between different positions in the organization. The clear structured organization - means the clear structured business workflow, which is the core of success in the business. ConceptDraw PRO is an org chart software that allows you to draw an organizational structure of your company quickly and easily.
HelpDesk

How to Create a TQM Diagram Using Total Quality Management Solution

TQM diagrams, created with ConceptDraw tools can be used for developing improvement plans and quality solutions in a bushiness organization.
HelpDesk

How to Create Organizational Chart Quickly

Use ConceptDraw MINDMAP for generating structured data on organization structure and then ConceptDraw PRO for presenting the results as chart.

Management Diagrams, Matrixes, Organizational Charts, decision making, scheduling, thinking ideas, problem solving, business planning, company organizing, SWOT analysis Management

Management Diagrams, Matrixes, Organizational Charts, decision making, scheduling, thinking ideas, problem solving, business planning, company organizing, SWOT analysis
This solution extends ConceptDraw PRO v9 and ConceptDraw MINDMAP v7 with Management Diagrams and Mind Maps (decision making, scheduling, thinking ideas, problem solving, business planning, company organizing, SWOT analysis, preparing and holding meetings

organizational chart, org chart Organizational Charts

organizational chart, org chart
Organizational Charts solution extends ConceptDraw PRO software with samples, templates and library of vector stencils for drawing the org charts.
HelpDesk

How to Use ConceptDraw Sales Dashboard Solution

The interactive visual dashboard is a valuable tool for any sales team. Sales dashboard allows you to view and monitor sales indicators that are important for manager and sales staff . It helps to use the timely and reliable information to improve the quality of sales performance and increase sales revenues. ConceptDraw Sales Dashboard solution is a tool for both: sales manager and sales team. It provides the visualization of key performance indicators that are critical to the entire sales organization. The custom sales dashboard displays the real-time information on sales performance KPIs with the help of intuitive and easy-to-understand diagrams and charts. Sales Dashboard helps the entire team see where they are, and what needs to be done. With ConceptDraw PRO you can easily create a visual Sales Dashboard using Live Objects Technology.
ConceptDraw Live Visual Dashboards
HelpDesk

How to Create a Hook Up Diagram

Hook-up diagram of audio-video system is a detailed drawing showing the audio video connections in a correct manner so that system operates properly. Using the hook up diagram you can understand how the elements of your audio-video system should be installed. ConceptDraw PRO allows you to draw the Hook Up diagram of Audio-Video system easily using the set of special libraries provided by Audio and Video Connectors solution.
HelpDesk

How to Create a VSM Diagram Using ConceptDraw Value Stream Mapping Solution

Value Stream Mapping is a Lean Manufacturing tool that uses a flow diagram to document in great detail every step of a manufacturing process. This graphical representation of a process is a powerful tool that helps in the diagnosis of process efficiency and allows companies to develop improved processes. Many lean practitioners use Value Stream Mapping as a fundamental tool to identify waste, cut process cycle times, and implement process improvement. Many organizations use value stream mapping as a key portion of their lean efforts. Value Stream Maps are used to analyze and design the flow of materials and information required to bring a product or service to a consumer. You can create a Value Stream Mapping flowchart using ConceptDraw PRO tools.

Project Management, project team, project, organization charts, project calendar, human resources managers, solution park PM Teams

Project Management, project team, project, organization charts, project calendar, human resources managers, solution park
This solution extends ConceptDraw Office 2.0 products with a single information space for messaging to teams.

organizational chart examples, business organizational chart, organogram, organigram, organizational structure , corporate hierarchy, organizational structure chart, organizational management , org chart maker, how to make an organizational chart, busines 25 Typical Orgcharts

organizational chart examples, business organizational chart, organogram, organigram, organizational structure , corporate hierarchy, organizational structure chart, organizational management , org chart maker, how to make an organizational chart, busines
The 25 Typical Orgcharts solution contains powerful organizational structure and organizational management drawing tools, a variety of professionally designed organization chart and matrix organization structure samples, 25 templates based on various orga
HelpDesk

How to Draw an Electrical Scheme Using ConceptDraw Solution Park

The ability to  visualize industrial systems in electronics, electrical, chemical, process, and mechanical engineering is delivered by the ConceptDraw Engineering solution.
HelpDesk

How to Create an AWS Architecture Diagram

Displaying an Amazon Web Service (AWS) cloud actually requires large amounts of attention to detail. Every element of technology has to be addressed: software, middle ware, transaction processing, scaling, data storage; the complete list is staggering. Using the ConceptDraw AWS Architecture Diagrams solution makes much easier the work on documenting the Amazon Web Service architecture. The ConceptDraw AWS Architecture Diagrams solution includes icons, sample and templates for some Amazon Web Services products and resources, to be used when buiding architecture diagrams. The icons are simple so that user can easily incorporate them in his drawings. AWS Architecture Diagrams can be used in presentations, datasheets, or any other technical visualizations.
HelpDesk

How to Create a Workflow Diagram Using ConceptDraw Solution Park

A workflow diagram is a specialized type of flowchart. With the help of a workflow diagram you can visually describe the tasks, documents, people responsible for execution at each stage of workflow. The ability to create Workflow diagrams is contained in the ConceptDraw Workflow Diagrams solution.
HelpDesk

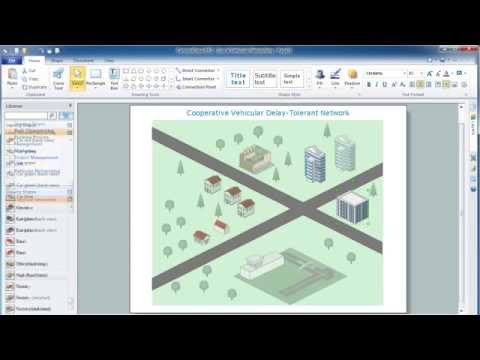
How to Create a Vehicular Network Diagram

ConceptDraw Vehicular Networking solution can help network engineers, network architects to design, analyze and present vehicular network diagrams quickly and efficiently. Solution provides a possibility to swiftly develop conceptual diagrams for vehicular networking. A set of templates and objects delivered with this solution allows making conceptual diagrams of global and local vehicular networks. Using the Vehicular Networking solution makes much easier the work on documenting the Vehicular Networks.
Create Vehicular Network Diagrams
HelpDesk

How to Create an Entity-Relationship Diagram Using ConceptDraw Solution Park

An entity-relationship diagram (ERD)is used in a database modeling process. ERD diagram shows a graphical representation of objects or concepts within an information system and their relationships.The ability to  describe a database using the Entity-Relationship model is delivered by the ConceptDraw ERD solution.